






- Ethereum recovers above key support as buyers await a breakout beyond resistance.
- Technical momentum improves, but Ethereum still faces pressure below major EMAs.
- Spot inflows signal renewed demand as traders cautiously rebuild positions this week.
Ethereum extended its recovery this week as improving global risk sentiment supported demand across digital assets. The cryptocurrency advanced alongside Bitcoin after easing geopolitical concerns reduced pressure on financial markets.
Lower fears surrounding tensions between the United States and Iran encouraged investors to return to riskier assets, helping lift the broader crypto market. Even so, Ethereum still faces an important technical test because buyers have yet to overcome a major resistance level that could determine the next directional move.
Technical Picture Continues to Improve
Ethereum currently trades near $1,771 after recovering from its recent swing low around $1,512. The asset continues to hold above its 20-day exponential moving average at $1,721, signaling that short-term momentum has improved. However, the price remains below the 50-day EMA at $1,798, showing that the broader trend still requires confirmation.
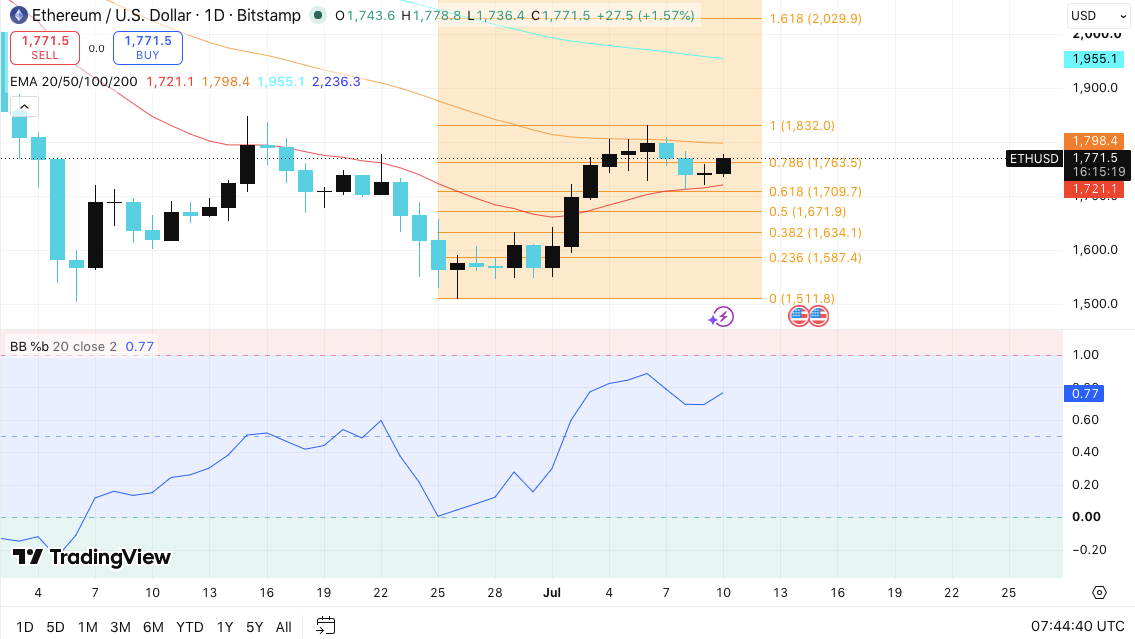
Additionally, buyers continue defending higher lows, which reflects growing confidence despite repeated rejection near recent highs. The Bollinger Band %B reading near 0.77 also suggests Ethereum trades in the upper portion of its recent range without entering overbought territory.
Immediate support stands near $1,763, which aligns with the 0.786 Fibonacci retracement level. Below that, the 20-day EMA at $1,721 and the $1,710 Fibonacci level provide additional support. If selling pressure accelerates, Ethereum could revisit the stronger demand zone between $1,672 and $1,634.
Related: XRP Price Prediction: Is XRP Setting Up a 1,000% Move or Just Retesting the Same Resistance?
On the upside, the 50-day EMA at $1,798 remains the first obstacle. A successful breakout above that level could shift momentum toward $1,832. Consequently, buyers may target the 100-day EMA near $1,955 if bullish momentum strengthens further.
Derivatives and Spot Flows Show Cautious Optimism
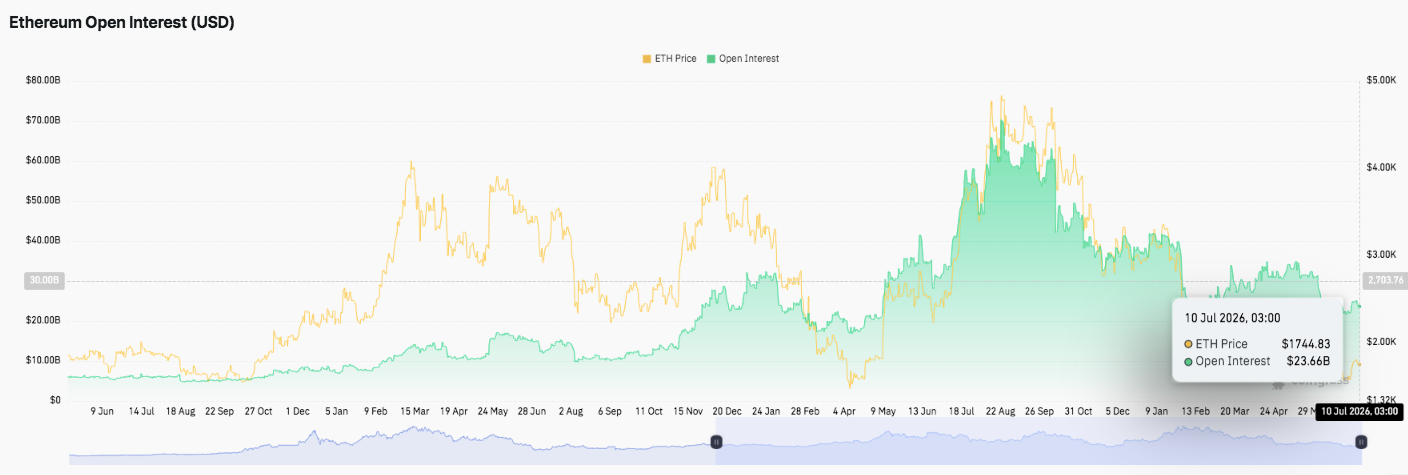
Derivatives data also points to a more balanced market environment. Ethereum’s open interest climbed above $60 billion during its earlier rally before dropping sharply as leveraged traders reduced exposure. That decline reflected profit-taking and liquidation activity across futures markets.
Recently, open interest stabilized near $23.66 billion. This trend suggests traders have started rebuilding positions without aggressively increasing leverage. Besides, the steadier positioning indicates many participants prefer waiting for a confirmed breakout before expanding exposure.
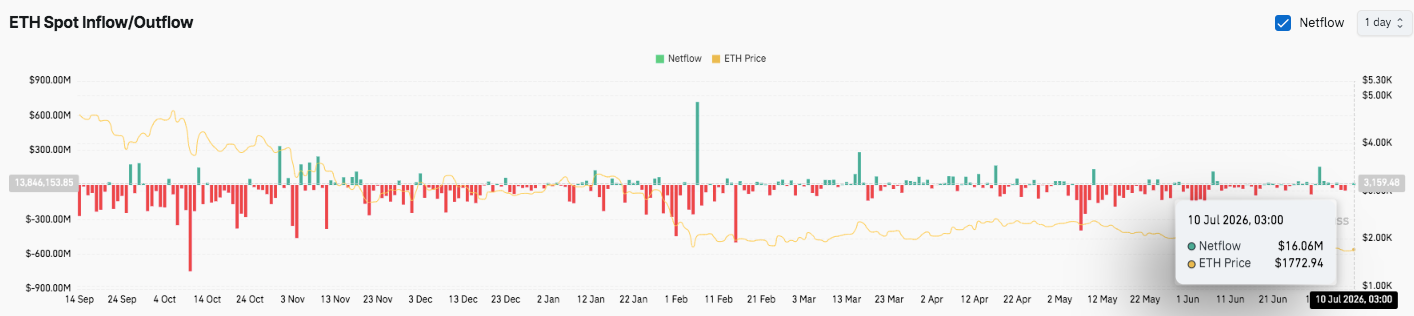
Spot market activity paints a similar picture. Exchange flows remained mixed over recent months as periods of accumulation alternated with continued selling.
Related: Velvet Price Prediction: Velvet Price Jumps 30% as Bulls Eye $0.54 Breakout
However, the latest net inflow of approximately $16.06 million signals renewed buying interest. Moreover, the positive flow suggests investors continue accumulating Ethereum despite ongoing resistance near current levels.
Technical Outlook for Ethereum Price
Key technical levels are becoming increasingly important as Ethereum attempts to extend its recovery while trading above the 20-day EMA but below the 50-day EMA.
Upside levels: $1,798 (50-day EMA), followed by $1,832, with a successful breakout opening the door toward the $1,955 (100-day EMA). A sustained move above $1,955 would strengthen the medium-term bullish structure and shift focus toward the psychological $2,000 level.
Downside levels: Initial support lies at $1,763 (0.786 Fibonacci retracement), followed by the 20-day EMA at $1,721 and the 0.618 Fibonacci level at $1,710. A deeper correction could send ETH toward the $1,672–$1,634 demand zone, where buyers previously stepped in.
Resistance ceiling: The $1,798 50-day EMA remains the key barrier that bulls must reclaim to confirm stronger upside momentum. Until then, Ethereum may continue consolidating below this level.
The broader technical setup points to a recovery attempt rather than a confirmed trend reversal. Higher lows and improving momentum indicate buyers are gradually regaining control, while stable open interest and modest spot inflows suggest cautious accumulation instead of aggressive speculation.
Will Ethereum Go Up?
Ethereum’s near-term outlook depends on whether buyers can convert the $1,798 resistance into support. A decisive daily close above this level could accelerate momentum toward $1,832 and eventually the $1,955 100-day EMA. Continued stabilization in derivatives positioning and positive spot netflows would further strengthen the bullish case.
Related: Cardano Price Prediction: Hoskinson Calls Ethereum’s EUTXO Move a Crime as ADA Holds the 20-Day EMA
However, failure to hold above the 20-day EMA at $1,721 would weaken the current recovery and increase the risk of a decline toward $1,710 and the $1,672–$1,634 support zone. For now, Ethereum remains at a critical technical crossroads, with price action likely to be driven by confirmation of either a breakout above resistance or a loss of key support.
Disclaimer: The information presented in this article is for informational and educational purposes only. The article does not constitute financial advice or advice of any kind. Coin Edition is not responsible for any losses incurred as a result of the utilization of content, products, or services mentioned. Readers are advised to exercise caution before taking any action related to the company.




