

- Ethereum traded near $2,697 after clearing the daily range high of $2,649.89.
- The chart marks $2,787 as Ethereum’s next upside buy-side liquidity target.
- The projected rebound requires support at $2,587–$2,607; a retest is unconfirmed.
| ETH PRICE AT WRITING | COMPLETED PRICE MOVE | REACTION ZONE | UPSIDE TARGET |
| Near $2,787 | Above September 19 High | $2,587–$2,607 | $2,787 |
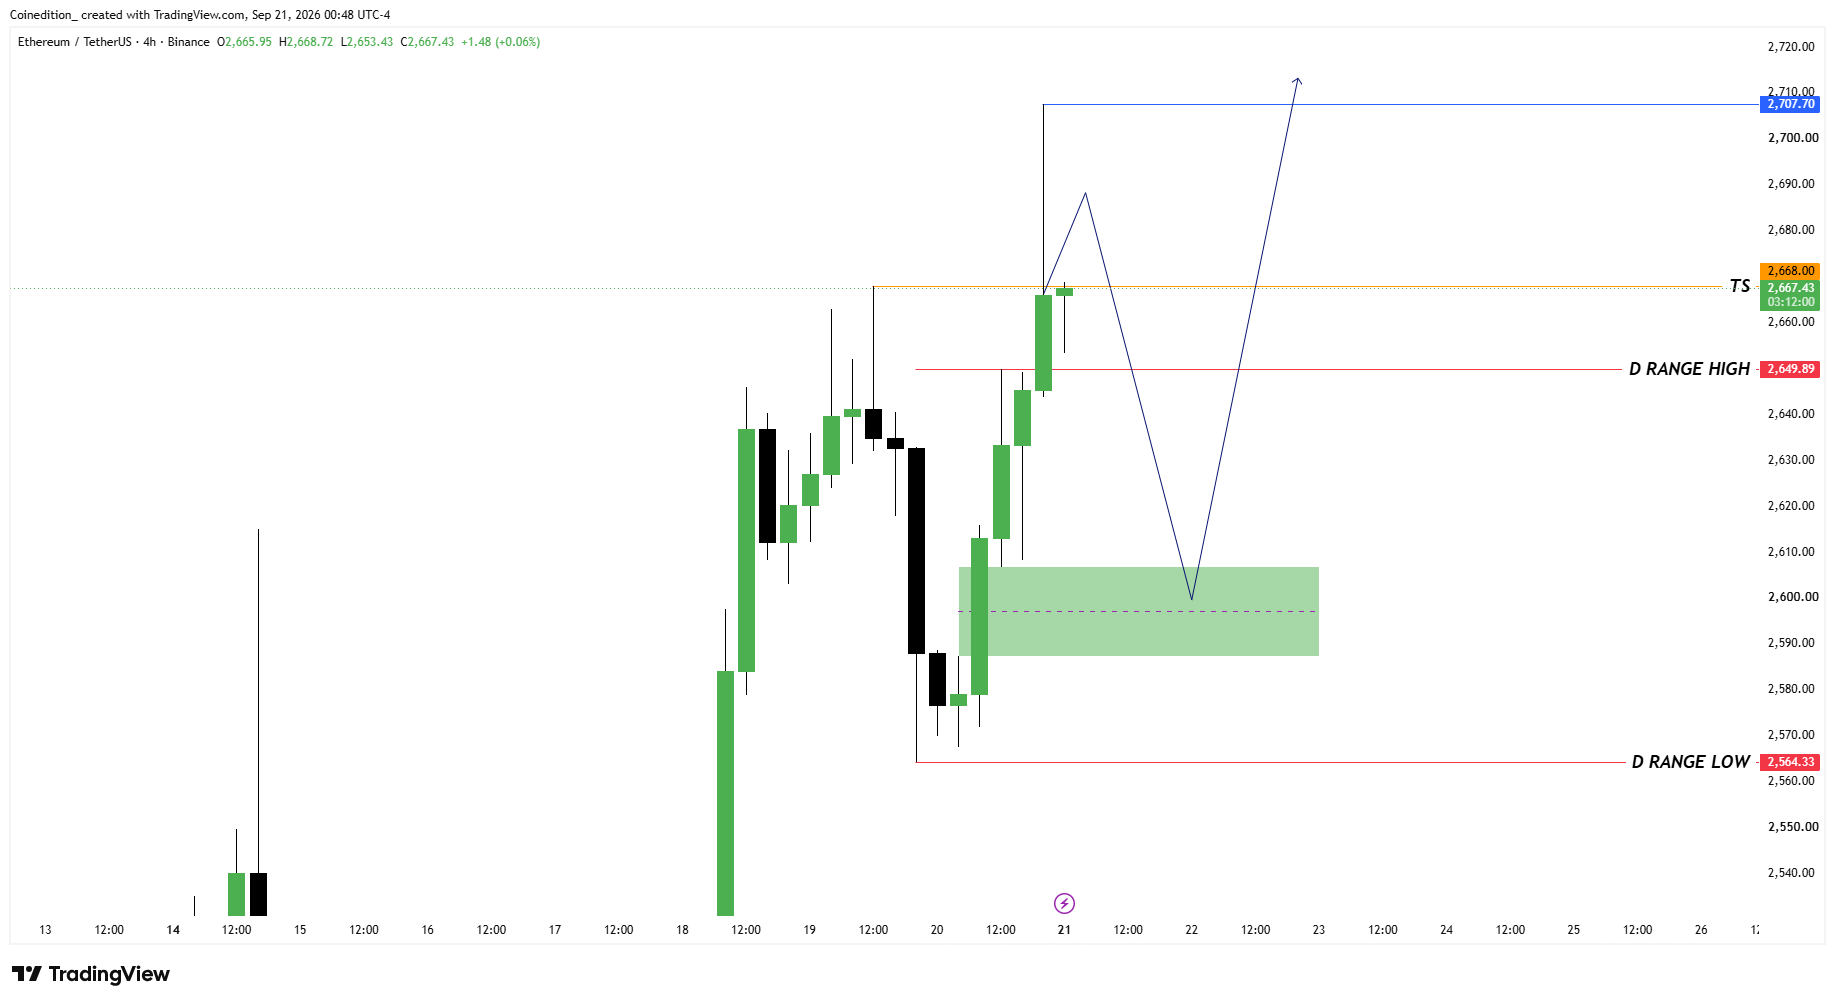
Ethereum moved above the September 19 high and the marked daily range high of $2,649.89, trading near $2,697 at the time of writing. The chart identifies $2,787 as the buy-side liquidity target and outlines a possible retracement into $2,587–$2,607 before another advance.
That sequence remains a projection; the chart does not establish that the retracement or subsequent rally has occurred. ETH recovered from approximately $2,575 and moved above $2,649.89.
The projected continuation depends on a successful test of the highlighted internal reaction zone. The marked daily range low stands at $2,564.33.
Completed Liquidity Event and Higher-Timeframe Context
The supplied analysis identifies Ethereum’s move through the September 19 high as a completed liquidity event. Price also crossed the marked daily range high during its recovery. Several consecutive bullish candles appeared after the pullback toward $2,575. The latest candle had a smaller size near $2,668 than the preceding candles.
Source: TradingView
These observations set the recovery and the position of price relative to the marked range. They do not confirm the next movement shown by the chart’s projected path. The four-hour setup places Ethereum above the $2,649.89 upper boundary, with $2,564.33 marking the lower boundary.
Lower-Timeframe Confirmation
The accompanying analysis sets out a confirmation framework for any retracement into the highlighted support area. It calls for a bullish market structure break on the 15-minute or one-hour chart, followed by a demand-zone retest.
The framework also includes above-average buying volume as an additional confirmation condition. However, the supplied four-hour chart summary does not establish that these lower-timeframe conditions have occurred.
A support-zone touch, a structural break, and a follow-up retest are separate steps within that framework. The projected recovery therefore remains conditional until the specified price action develops.
The analysis also describes an alternative sequence involving an impulsive lower-timeframe breakdown followed by rejection. That sequence belongs to the failure scenario, rather than the completed price action.
Immediate Price Draw or Reaction Zone
The chart’s projected path first extends toward approximately $2,688. It then turns lower toward the highlighted $2,587–$2,607 support band before outlining another advance. A dashed line near $2,597 marks the midpoint within that area. The projection places the follow-up recovery after the proposed test of this zone.
The daily range high of $2,649.89 sits above the reaction band. However, the displayed retracement includes a move back below the range high before reaching the highlighted support.
Under the supplied scenario, buyers would then defend that support before attempting to reach the upside liquidity target. Neither the support test nor its outcome is confirmed in the chart description.
Continuation Target
The primary buy-side liquidity target is $2,707.70. Although the projected line extends slightly above that level, the extension is part of the hypothetical path.
Key Levels
| Chart Reference | Price |
| Buy-Side Liquidity Target | $2,787 |
| Projected Initial Advance | Approximately $2,688 |
| Nearby Resistance | Approximately $2,668 |
| Daily Range High | $2,649.89 |
| Internal Reaction Zone | $2,587–$2,607 |
| Reaction-Zone Midpoint | Approximately $2,597 |
| Daily Range Low | $2,564.33 |
Continuation Case: The supplied scenario requires the internal reaction zone to hold before a renewed move toward $2,707.70.
Failure Case: The analysis identifies $2,564.33 as the next downside reference if buyers fail to defend the highlighted zone.
Bottom Line: Ethereum has crossed the September 19 high. The retracement and continuation shown on the chart remain unconfirmed.
FAQs
That sequence appears in the chart’s projection.
It is the highlighted reaction zone preceding the proposed recovery.
Price crossed the previous high identified in the analysis.
The marked target is $2,787
The supplied analysis identifies failure to hold $2,587–$2,607 as a threat to the projected continuation.
Related: Ethereum Price Prediction: BlackRock Reportedly Buys $1.5B in ETH as Rally Extends
Disclaimer: The information presented in this article is for informational and educational purposes only. The article does not constitute financial advice or advice of any kind. Coin Edition is not responsible for any losses incurred as a result of the utilization of content, products, or services mentioned. Readers are advised to exercise caution before taking any action related to the company.