



- Ethereum trades above all four major EMAs, with $2,446.45 resistance determining its next bullish move.
- Open interest has fallen from $70 billion to $28.22 billion, signaling reduced leveraged speculation.
- ETH recorded $7.26 million in exchange outflows, suggesting mild accumulation amid mixed investor sentiment.
Ethereum (ETH) is attempting to strengthen its recovery as buyers push prices toward a critical resistance zone. The cryptocurrency trades around $2,424.10 on the daily Binance chart, maintaining its position above all four major exponential moving averages. This development suggests improving market conditions after an extended decline from the $2,800 region.
Ethereum Price Recovery Faces a Major Technical Test
Ethereum’s recovery has improved its technical outlook, with buyers reclaiming several important price levels. ETH currently trades above its 20-day, 50-day, 100-day, and 200-day EMAs. The 20-day EMA at $2,364.39 provides immediate support during potential pullbacks.
Besides, the 50-day EMA at $2,411.36 offers another important level for buyers. The 100-day EMA stands at $2,353.96, while the 200-day EMA sits at $2,318.26. Maintaining these levels would strengthen the recovery and improve bullish confidence.
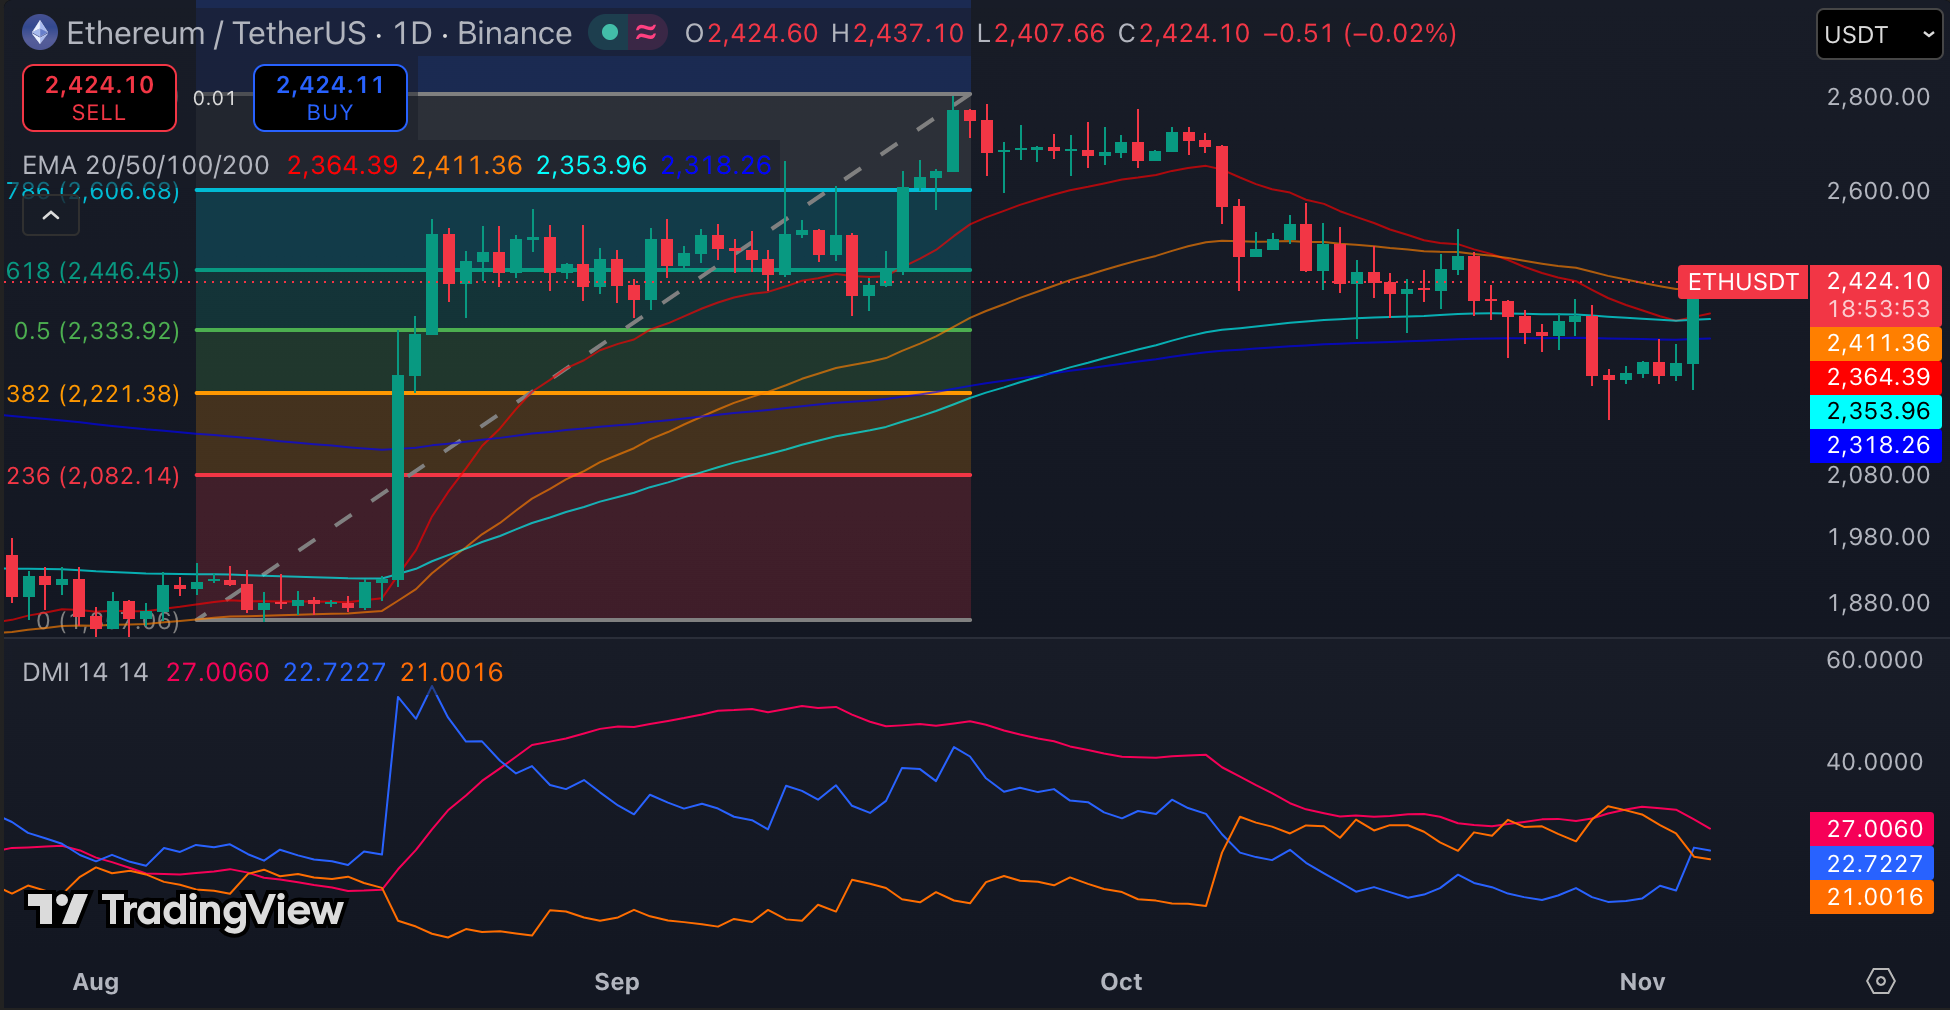
However, Ethereum must overcome resistance at $2,446.45 to establish stronger upward momentum. This level represents the 0.618 Fibonacci retracement and currently limits further gains. A decisive daily close above it could encourage additional buying.
Consequently, ETH could advance toward the $2,500-2,520 resistance zone. A successful breakout above that region would expose the $2,606.68 level. This represents the 0.786 Fibonacci retracement.
The Directional Movement Index also provides encouraging signals. The positive directional indicator stands at 27.01, exceeding the negative indicator at 22.72. However, the ADX reading of 21 suggests relatively weak trend strength.
Open Interest Reveals Reduced Speculative Activity
Ethereum’s derivatives market presents a more cautious picture despite improving price action. Open interest increased dramatically from approximately $6 billion in August 2025. It eventually approached $70 billion in August 2026.
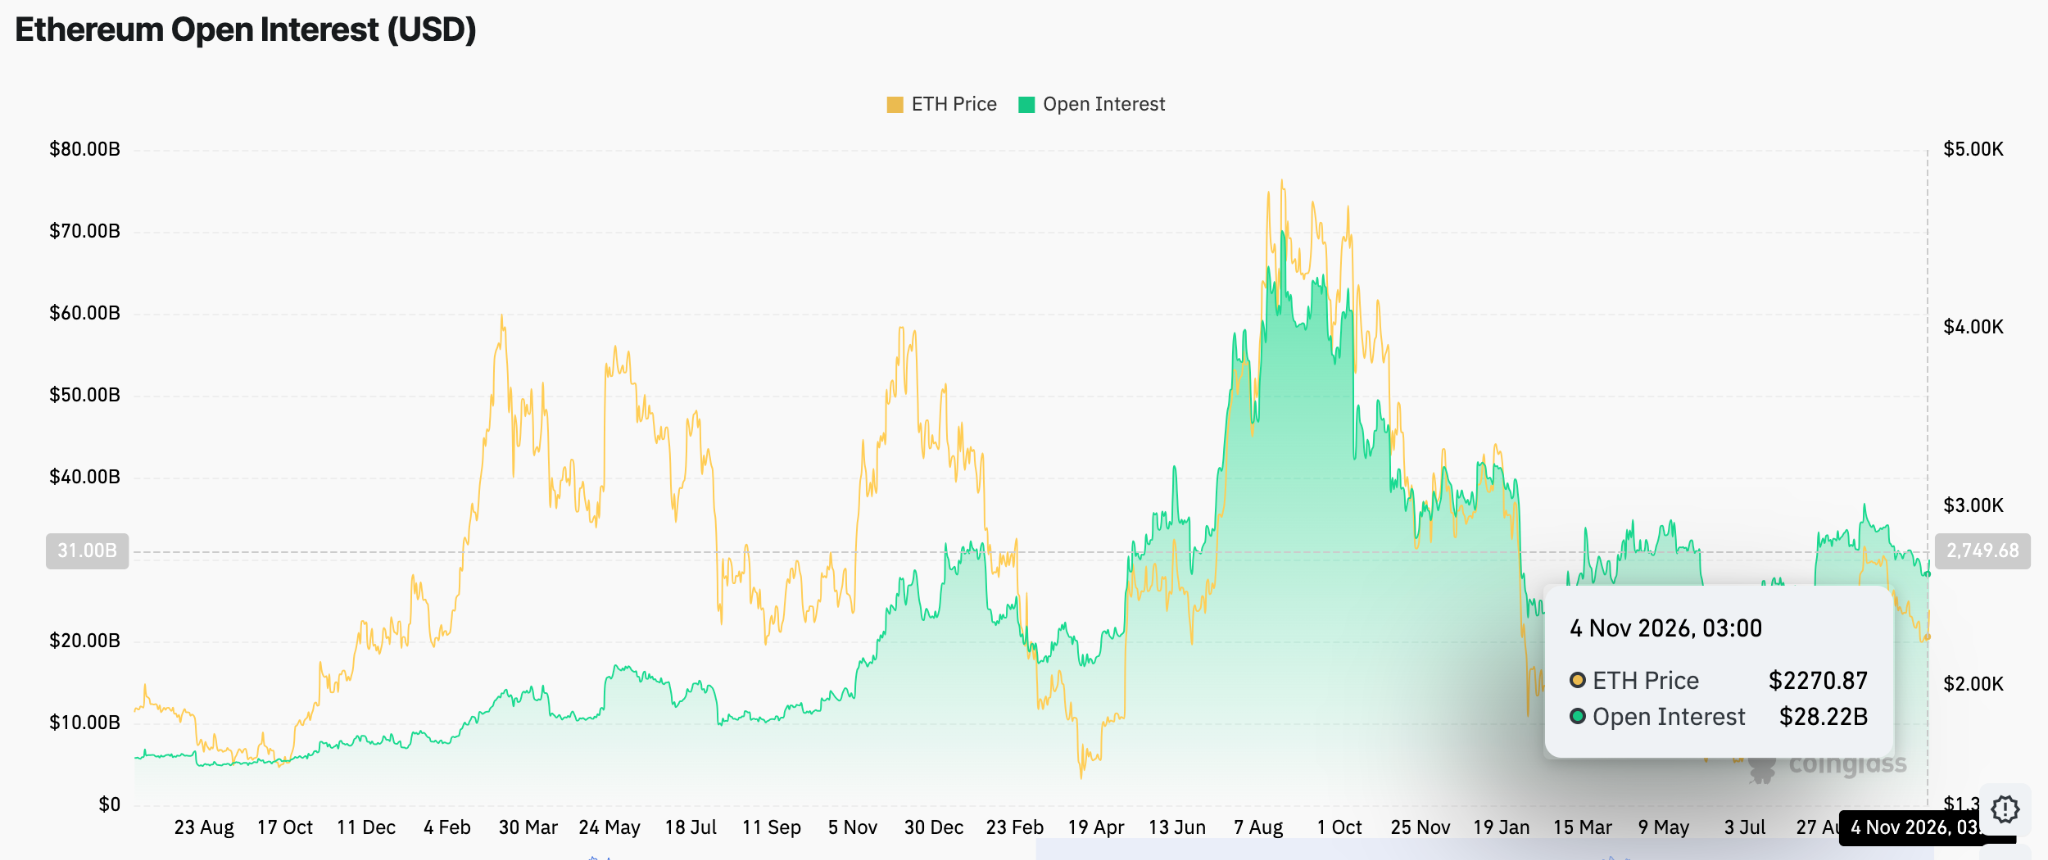
This expansion accompanied a significant Ethereum price rally and increased speculative participation. However, open interest subsequently declined toward $20 billion in early 2027.
The metric later recovered, fluctuating between $25 billion and $35 billion. On November 4, 2026, Ethereum’s open interest reached approximately $28.22 billion.
This reading indicates reduced derivatives exposure compared with the previous peak. Hence, traders appear less aggressive when opening leveraged positions. Lower open interest could reduce liquidation risks, but it also reflects weaker speculative demand.
Exchange Flows Show Mixed Investor Sentiment
Ethereum’s exchange flows provide additional insight into investor positioning. Netflows remained predominantly negative between January and August. This pattern suggests investors consistently withdrew ETH from exchanges.
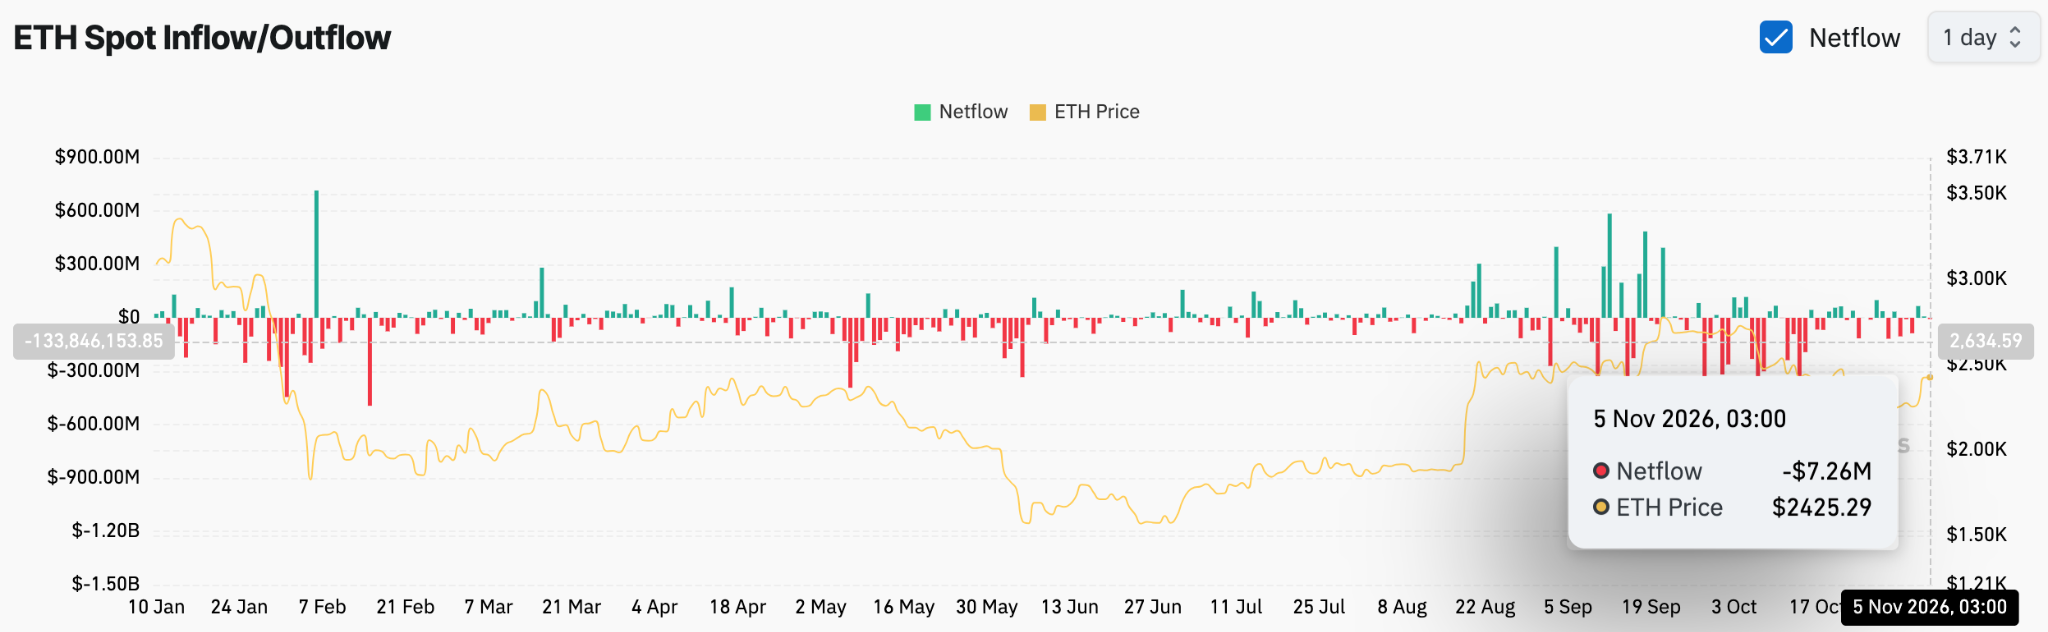
However, February and March recorded notable inflows, indicating temporary increases in potential selling pressure. September experienced particularly large positive netflow spikes. Some exceeded $500 million, highlighting substantial exchange deposits.
Additionally, October recorded significant outflows amid continued market uncertainty. The latest November 5 reading showed a net outflow of $7.26 million. This modest withdrawal suggests mild accumulation rather than aggressive selling.
Technical Outlook for Ethereum Price
Key levels remain well-defined heading into the next trading sessions.
Upside levels: $2,446.45 represents immediate Fibonacci resistance, followed by $2,500-2,520. A successful breakout could extend toward $2,606.68.
Downside levels: $2,411.36 (50-day EMA) provides immediate support, followed by $2,364.39, $2,353.96, and $2,318.26 (200-day EMA).
Resistance ceiling: $2,446.45 is the critical level ETH must reclaim to strengthen its bullish momentum. The technical picture shows a recovery above all four major moving averages, although the ADX reading of 21 indicates limited trend strength.
Will Ethereum Go Up?
Ethereum’s price prediction hinges on whether buyers can secure a daily close above $2,446.45 and sustain upward momentum. A breakout could push ETH toward $2,500-2,520, with $2,606.68 emerging as the next major target. Additionally, recovering open interest and recent exchange outflows suggest changing investor positioning.
However, traders need stronger participation to confirm a sustainable rally. Failure to defend $2,411.36 could expose ETH to $2,364.39 and $2,353.96. A deeper breakdown below $2,318.26 would weaken the recovery and expose $2,221.38. For now, Ethereum remains at a pivotal turning point, with the $2,446 resistance likely to determine its next major move.
Disclaimer: The information presented in this article is for informational and educational purposes only. The article does not constitute financial advice or advice of any kind. Coin Edition is not responsible for any losses incurred as a result of the utilization of content, products, or services mentioned. Readers are advised to exercise caution before taking any action related to the company.