
- ETH trades at $2,391, up 2.74%, pressing the upper Bollinger Band at $2,474 with MACD turning positive on the daily for the first time since February.
- Ethereum spot ETFs recorded $43.36M on April 21, the ninth consecutive day of net inflows, with total net assets at $13.66B.
- Etherealize set a $250,000 long-term ETH price target, arguing ETH is the first monetary asset in history that compounds without counterparty risk.
ETH trades at $2,391 on April 22, up 2.74%, pressing the upper Bollinger Band at $2,474 as the MACD turns positive for the first time since February, ETF inflows hit a ninth straight day, and Etherealize publishes a $250,000 long-term price target calling ETH better money than Bitcoin.
ETH Daily Chart: MACD Turns Positive As Price Tests The Upper Bollinger Band
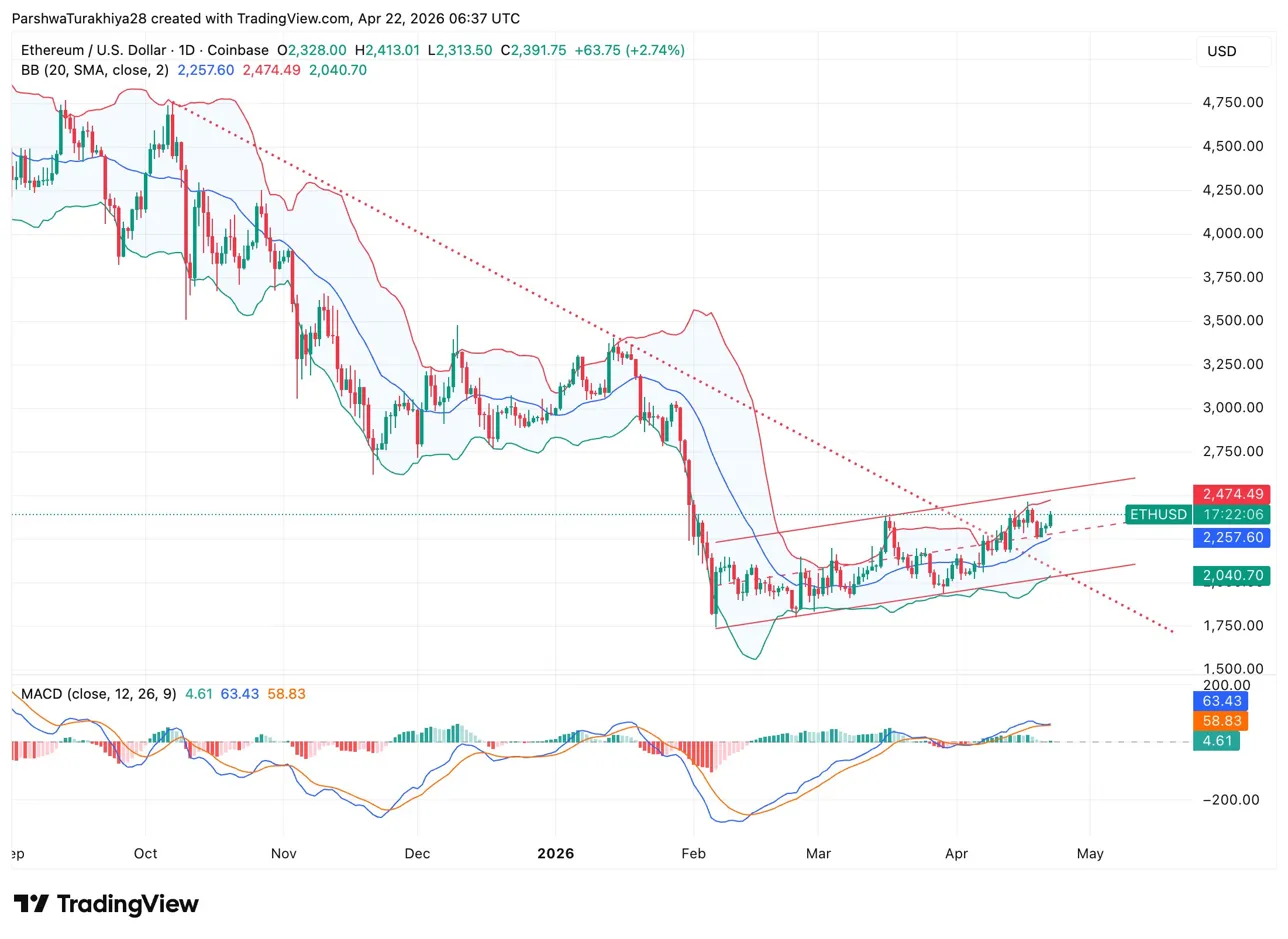
The descending channel from the October peak near $4,750 remains the long-term structure. Since the February low near $1,750, ETH has been recovering inside an ascending wedge with the Bollinger Bands expanding as price pushes higher. The upper band at $2,474 is the immediate resistance, middle band at $2,257 is the support below, and lower band at $2,040 is the floor.
The MACD fast line at 4.61 crossed above the signal line at 63.43 with the histogram positive at 58.83, the first bullish cross on the daily since February. That February cross preceded the move from $2,000 toward $3,200 in the prior cycle. A daily close above the upper Bollinger Band at $2,474 puts the descending channel upper boundary near $2,500 to $2,600 in view. Losing the middle band at $2,257 on a daily close puts the lower band at $2,040 in play.
Key levels for April 23:
- Lower Bollinger Band: $2,040
- Middle Bollinger Band: $2,257
- Upper Bollinger Band: $2,474
- Descending channel upper boundary: $2,500 to $2,600
- February low: $1,750
Nine Straight Days Of ETH ETF Inflows As BlackRock Leads
ETH spot ETFs recorded $43.36M on April 21, the ninth consecutive day of net inflows. BlackRock’s ETHA led with $37.00M. Total net assets sit at $13.66B, 4.89% of Ethereum’s market cap. The streak covers April 13 through April 21 with no single outflow day in between.
Related: Bitcoin Price Prediction: Will BTC Stay Above $78,000 After Ceasefire Boost?
Nine straight days of inflows without a break is the longest consecutive run since ETH ETFs launched. The cumulative total sits at $12.05B. That kind of sustained institutional demand alongside ETH breaking above $2,300 and pressing the upper Bollinger Band makes the current setup different from prior recovery attempts that lacked the ETF bid underneath.
Etherealize Cuts ETH Target To $250,000 And Says It Is Better Money Than Bitcoin
Etherealize, the institutional marketing arm for the Ethereum ecosystem, updated its long-term ETH price target to $250,000, down from its previous $740,000 estimate. The argument rests on one central claim: ETH is the first monetary asset in history that compounds without counterparty risk. For all of human history, holding money meant accepting zero returns, while investing meant accepting risk. ETH dissolves that tradeoff by generating 2% to 4% staking returns as a pure bearer asset.
Etherealize co-founder Vivek Raman pointed to the combined monetary premium of gold and Bitcoin at roughly $31 trillion. If ETH captured the same premium at current circulating supply of 121 million ETH, the implied price exceeds $250,000. Mike McGuiness added that Bitcoin faces a structural risk in its security budget once all 21 million coins are mined, while ETH burns a portion of transaction fees and can become deflationary as usage grows. Raman was direct: if Bitcoin is the foregone conclusion for digital store of value, ETH is the other contender, and competing alt-L1s are execution layers, not money.
ETH Price Prediction: April 23 Outlook
- Upside: MACD stays positive, daily close above the upper Bollinger Band at $2,474 clears the immediate resistance, and the descending channel boundary at $2,500 to $2,600 becomes the next target. ETF inflows extending the nine-day streak keeps institutional demand active. Etherealize’s $250,000 narrative adds a long-term fundamental bid.
- Downside: Upper Bollinger Band at $2,474 holds as resistance, middle band at $2,257 breaks on a daily close, and the lower band at $2,040 becomes the next floor. Ceasefire uncertainty returning over the weekend adds macro pressure. A daily close below $2,040 puts the February low at $1,750 back in view.
Related: Cardano Price Prediction: ADA Forms Cup And Handle As Hoskinson Says Cardano Cracked The Code
Disclaimer: The information presented in this article is for informational and educational purposes only. The article does not constitute financial advice or advice of any kind. Coin Edition is not responsible for any losses incurred as a result of the utilization of content, products, or services mentioned. Readers are advised to exercise caution before taking any action related to the company.
")


