






- ETH trades at $2,244.22 on August 20, down 0.33%, breaking sharply above a months-long symmetric triangle
- Weekly ETH ETF inflows hit $291.47M with two trading days still left, closing in on 2026’s best week of $479.04M set in January
- Ethereum’s 24-hour derivatives volume jumped 370% to $105.59B, with shorts absorbing the bulk of $1.13B in liquidations
The ETH price prediction turns bullish after price broke decisively out of its multi-month triangle pattern, surging alongside a wave of ETF demand that could make this the strongest inflow week of the year. Analysts are increasingly framing the move as confirmation that Ethereum has entered a genuine bull phase, both against the dollar and against Bitcoin.
Ethereum Price Analysis: Will Ethereum Price Go Up After Breaking Its Multi-Month Triangle?
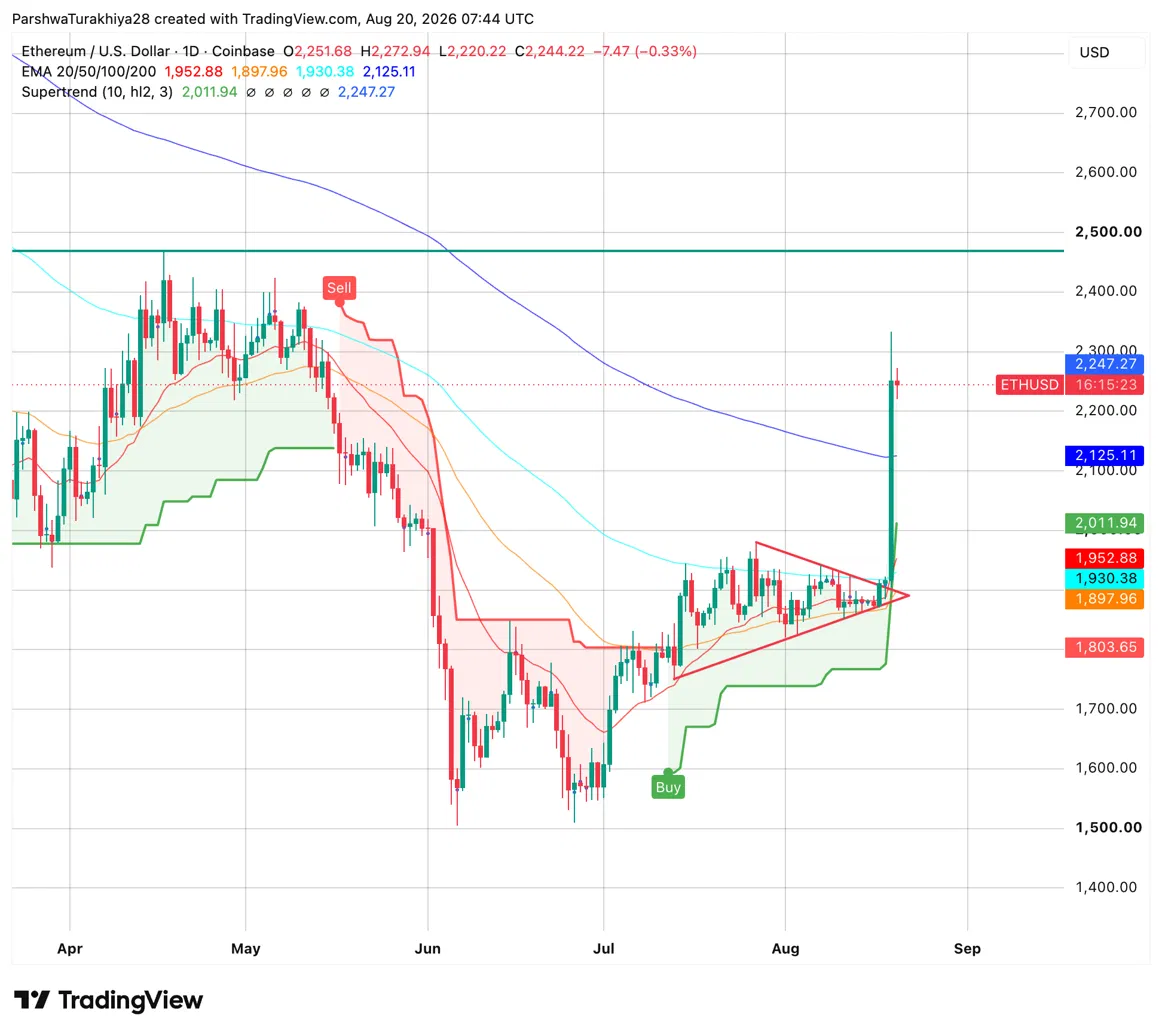
ETH broke sharply higher this week out of a symmetric triangle that had been building since early July, with the ascending support line starting near $1,750 and the descending resistance line capping every bounce since the late July peak. The breakout candle pushed price from around $2,020 to touch $2,272 before settling near $2,244.
The Supertrend indicator flipped bullish at $2,011.94, confirming the shift in trend, and price is now trading well above all four EMAs. The 20-day EMA at $1,952.88 marks the nearest support, followed by the 50-day at $1,930.38 and the 100-day at $1,897.96. The 200-day EMA at $2,125.11 has now been reclaimed as well, a level ETH hadn’t traded above since May.
Related: Bitcoin Price Prediction Breaks Out As Treasury Doubles Bond Buyback Program
A daily close that holds above $2,200 confirms the breakout is sticking rather than fading. The next resistance sits at the psychological $2,500 level.
ETH Support and Resistance Levels, August 20, 2026
| Type | Price | Level |
| Resistance | $2,272.94 | Session high |
| Resistance | $2,500 | Psychological level |
| Support | $2,125.11 | 200-day EMA, newly reclaimed |
| Support | $2,011.94 | Supertrend |
| Support | $1,952.88 | 20-day EMA |
| Support | $1,930.38 | 50-day EMA |
Ethereum News: ETH Breaks 9-Year Downtrend Against Bitcoin
Analyst OVcrypto said Ethereum is starting to break out of a 9-year downtrend against Bitcoin, pointing to the ETH/BTC ratio as a signal that Ethereum may be entering a period of outperformance against the broader market’s dominant asset.
Meanwhile, Michaël van de Poppe echoed that sentiment, noting ETH’s move swept price up to 0.033 BTC and calling it clear confirmation that Ethereum is now in a bull market, though he cautioned the rally likely won’t run in a straight line and that pullbacks should be treated as buying opportunities.
Separately, analyst EliZ said the exact timing of Ethereum’s next major move remains impossible to predict, whether it comes tomorrow, in a month, or in a year, and acknowledged price could even dip below current levels first. EliZ maintained that a large surge is still coming eventually, one that will catch most people off guard, and that only patient holders will be positioned to benefit from it.
Related: Chainlink Price Prediction Points To $14.50 As Cup And Handle Breakout Confirms
Ethereum News: Weekly ETF Inflows Near 2026’s Best Week
Ethereum ETFs pulled in $291.47M for the week through August 19, with two trading days still remaining before the week closes. That already makes it one of the strongest weeks of the year, and it’s within reach of the current 2026 record of $479.04M set in the week ending January 16.
Daily inflows have been building steadily, with $189.15M coming in on August 19 alone, led by BlackRock’s ETHA fund with $122.12M. Cumulative net inflow across all Ethereum ETFs now stands at $11.74B, with total net assets reaching $12.06B.
| Week Ending | Weekly Net Inflow |
| Jan 16, 2026 | $479.04M (2026 high) |
| Aug 19, 2026 (in progress) | $291.47M |
| Aug 7, 2026 | $244.94M |
| Jul 17, 2026 | $105.44M |
| Jul 10, 2026 | $84.42M |
Ethereum Derivatives: Trading Activity Explodes as Short Sellers Get Squeezed
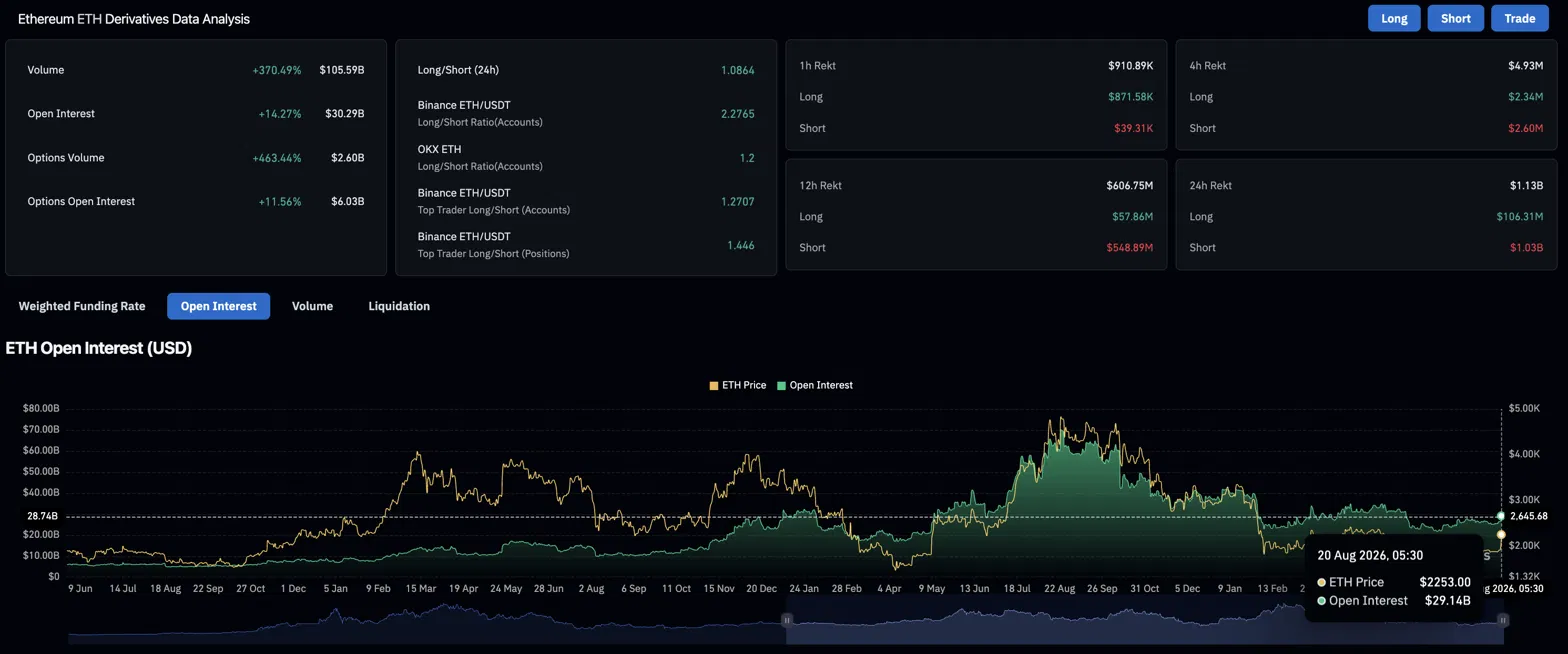
Ethereum’s derivatives market saw a massive surge in activity alongside the price breakout. Trading volume jumped 370% to $105.59B over the past 24 hours, showing a huge wave of traders entering positions around the move. Open interest, the total money currently tied up in open positions, also rose 14.27% to $30.29B, meaning this wasn’t just quick in-and-out trading but real new money staying in the market.
Options activity told a similar story, with options volume up over 463% to $2.60B, showing traders rushed to place bets on where ETH goes next.
Positioning has swung heavily bullish. Binance shows more than 2 long positions for every short, and OKX shows 1.2, meaning far more traders are now betting on ETH continuing higher than falling.
| Metric | Value | What it shows |
| Derivatives volume (24h) | $105.59B, up 370% | Trading activity exploded around the breakout |
| Open interest | $30.29B, up 14.27% | Real new money entered the market, not just quick trades |
| Options volume (24h) | $2.60B, up 463% | Traders rushed to bet on ETH’s next move |
| Binance long/short ratio | 2.2765 | More than 2 traders betting up for every 1 betting down |
That heavy bullish positioning shows up clearly in liquidations, which happen when a leveraged bet gets forcibly closed after price moves against it. Of the $1.13B wiped out over the past 24 hours, more than $1B came from short sellers who bet against the rally and got caught out as ETH surged. Longs lost only $106.31M in comparison. That pattern held on shorter timeframes too, with shorts taking the bigger hit over both the last 12 hours and the last hour, showing sellers kept getting squeezed as the breakout extended.
Will ETH Reach $2,500? Bullish and Bearish Ethereum Price Predictions
Bullish Case, Target: $2,500 (Psychological Level)
ETH holds above $2,200 on a daily close, confirming the triangle breakout wasn’t a false move. Weekly ETF inflows finish above the January record, and continued short covering adds fuel to the rally alongside growing analyst conviction that Ethereum has entered a genuine bull phase against both the dollar and Bitcoin. A sustained push clears the way toward $2,500.
Bearish Case, Risk Level: $2,011.94 (Supertrend)
ETH fails to hold $2,200 and profit taking sets in after the sharp move, consistent with van de Poppe’s expectation of retraces along the way up. ETF inflows cool off before reaching the January record, and the Supertrend at $2,011.94 becomes the level bulls need to defend. A daily close below that level would call the breakout’s strength into question, pulling price back toward the 20-day EMA at $1,952.88.
Conclusion
Ethereum’s breakout carries more independent confirmation than most triangle breaks do, a reclaimed 200-day EMA, a genuine shift in the ETH/BTC ratio, and ETF inflows closing in on a full-year record are three separate signals that don’t usually line up at the same time.
Related: Hyperliquid Price Prediction: HYPE Targets $77 After Breakout Above $72
Analyst EliZ’s framing is worth keeping in mind regardless: the timing of Ethereum’s next major move still can’t be predicted with precision, and a dip before the larger move plays out remains possible even within a genuine bull phase. The $2,200 daily close is the near-term marker that separates a confirmed breakout from a fading one, with $2,500 the reward if it holds.
FAQs
ETH trades at $2,244.22 after breaking above a months-long symmetric triangle. The bullish target is $2,500 at the psychological level, while the bearish risk level is $2,011.94 at the Supertrend if the breakout fails to hold.
Analysts including OVcrypto and Michaël van de Poppe say Ethereum is breaking a 9-year downtrend against Bitcoin, with the ratio pushing to 0.033 BTC, a shift that signals Ethereum may be entering a period of outperformance against the broader market’s dominant asset.
Weekly inflows have reached $291.47 million with two trading days left, putting the week within reach of the current 2026 record of $479.04 million set in mid-January.
Short sellers accounted for more than $1 billion of the $1.13 billion liquidated over 24 hours as price surged past their positions, with shorts continuing to take the bigger hit over both the last 12 hours and the last hour.
ETH is showing a rare combination of a confirmed technical breakout, record-approaching ETF demand, and a multi-year trend shift against Bitcoin, but the setup is still young enough that a pullback remains a real possibility. This is not financial advice, so weigh the bullish and bearish cases above against your own research and risk tolerance.
Disclaimer: The information presented in this article is for informational and educational purposes only. The article does not constitute financial advice or advice of any kind. Coin Edition is not responsible for any losses incurred as a result of the utilization of content, products, or services mentioned. Readers are advised to exercise caution before taking any action related to the company.




