


- The on-chain analytic platform founders opined that the current ETH price is an opportunity for long-term holders.
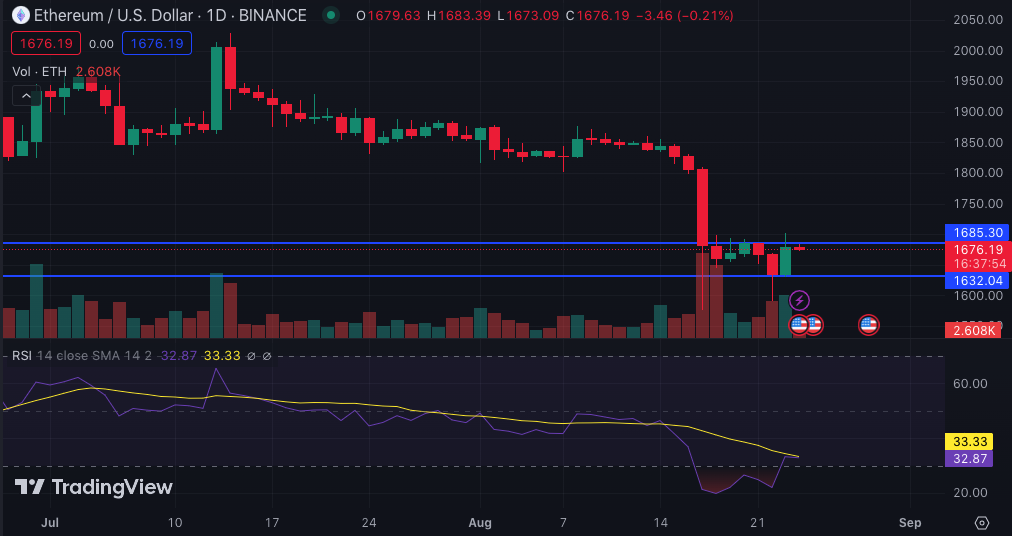
- ETH needs the RSI to rise above 32.86 for the altcoin to push above $1,700.
- If the CMF moves into the positive territory and the +DMI outpaces the -DMI, then ETH may move towards $2,000.
Like other cryptocurrencies, Ethereum (ETH) has been experiencing a bearish phase. One undeniable reason for the downturn is the widespread selling pressure that ETH was going through.
Amidst this bearish sentiment, notable figures in the industry, such as the founders of Glassnode, have weighed in with their insights. The founders Yann Allemann and Jan Happel, who share the X (formerly Twitter) handle Negentropic, suggest that ETH’s ongoing selling pressure might be setting the stage for a potential breakout.
Time for ETH to Breakout?
For Allemann and Happel, there was a key pivot at $1,680, which could lay the ground for the breakout. Also, the post added that the oversold state of ETH could attract long-term buyers while maintaining that ETH was not yet out of bearish control.
After falling briefly under $1,600, ETH rebounded. At the time of writing, the altcoin was trading at $1,676. However, the recovery is not yet full-blown as ETH’s attempt to push into $1,700 was rejected at $1,685 on the daily timeframe.
For ETH to rise above $1,700, bulls need to neutralize the dominance of sellers by instigating demand around $1,675. But if the price drops back to $1,632, the level may act as a support for ETH, and buying pressure could drive an uptrend.
Another crucial indicator to consider and may influence ETH’s trajectory is the Relative Strength Index (RSI). From the daily chart, bulls seem to have targeted the RSI value at 21.85. This resulted in a bounce to 32.86.
Although ETH was still oversold, bulls’ ability to sustain buying pressure would be instrumental in shifting ETH away from the bearish momentum.
Buyers and Sellers in a Tug of War
As for the Chaikin Money Flow (CMF), the 4-hour chart showed that it had reached the ceiling of the negative territory. At -0.04, the CMF signaled weakness in the market due to the selling pressure.
For the CMF to confirm a breakout, the indicator needs to move into the positive region while ETH breaks through the support and resistance lines. Thus, if the CMF moves above the zero line, then ETH might cross into the $1,700 region.
However, ETH’s potential could also depend on the Directional Movement Index (DMI). As of this writing the +DMI (green) and -DMI (red) were almost at loggerheads. Furthermore, the Average Directional Index (ADX) was up high at 42.58.

Since the ADX (yellow) indicated a strong directional movement, large buy orders may send ETH much above $1,700. But for this to happen, buyers need to win the struggle with sellers.
Disclaimer: The views, opinions, and information shared in this price prediction are published in good faith. Readers must do their research and due diligence. Any action taken by the reader is strictly at their own risk. Coin Edition and its affiliates will not be liable for direct or indirect damage or loss
Disclaimer: The information presented in this article is for informational and educational purposes only. The article does not constitute financial advice or advice of any kind. Coin Edition is not responsible for any losses incurred as a result of the utilization of content, products, or services mentioned. Readers are advised to exercise caution before taking any action related to the company.


