


 Price Plummets, Bulls Struggle to Recover")
- FTM hits a 30-day low amidst bearish market sentiments.
- Trading volume remains active despite the recent drop.
- Keltner Channel indicates a possible buying opportunity for FTM.
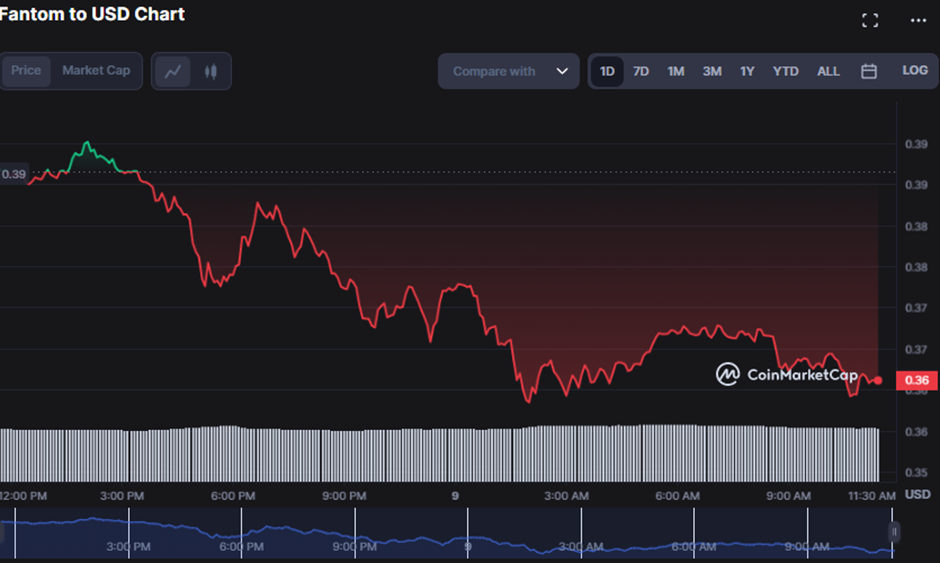
The price of Fantom (FTM) has hit a new 30-day low of $0.3578 as selling pressure in the market has increased over the past 24 hours. At the day’s high of $0.3903, bullish attempts to regain market share were met with strong resistance. Bearishness in the FTM market persisted, valuing the price at $0.3611 as of press time, a 6.69% drop.
During the recession, the market capitalization fell by 6.6% to $1,003,002,967, indicating that investors are likely cautious and waiting for a more favorable market condition before making significant investments in FTM.
The 24-hour trading volume accelerated by 1.64% to $191,326,335 indicating that there is still a reasonable level of activity despite the recent drop. This motion reflects the interest in the market, which could indicate resilience and the potential for recovery soon.
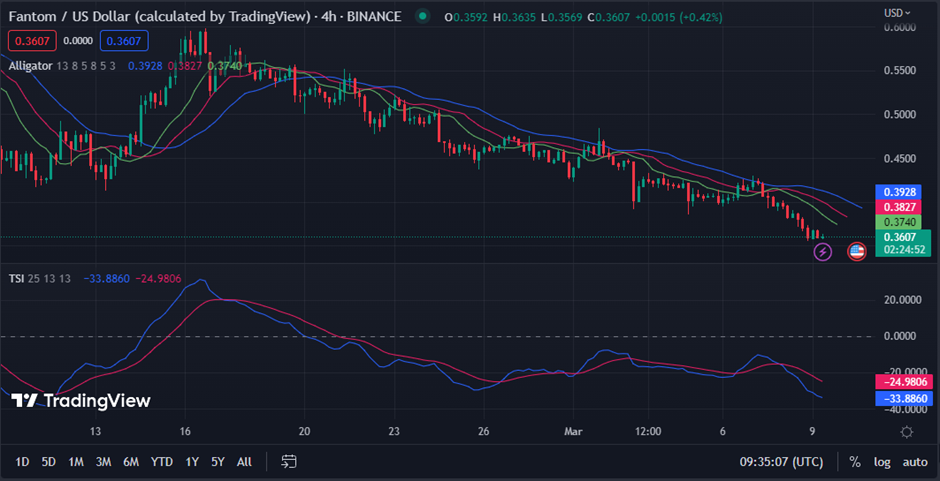
The three lines move downstream with a closed mouth, as projected by the Williams Alligator, indicating a negative trend. At 0.3928, 0.3827, and 0.3740, the blue (jaw), red (teeth), and green (lips) lines cross, respectively.
Price movements below the alligator’s mouth indicate that the market is entering a downtrend, and traders should consider selling or shorting positions.
This idea stems from the signs suggesting bearish supremacy will last for the foreseeable future, bolstering the bear run. However, bulls still have a shot at recovery since the price action is developing a green candlestick.
With a reading of -33.7010, the True Strength Index (TSI) has moved below its signal line into the negative territory, suggesting that there is still bearish pressure in the market. However, a reversal of this trend would signal a possible shift in momentum towards the bulls if the TSI were to cross back above its signal line.
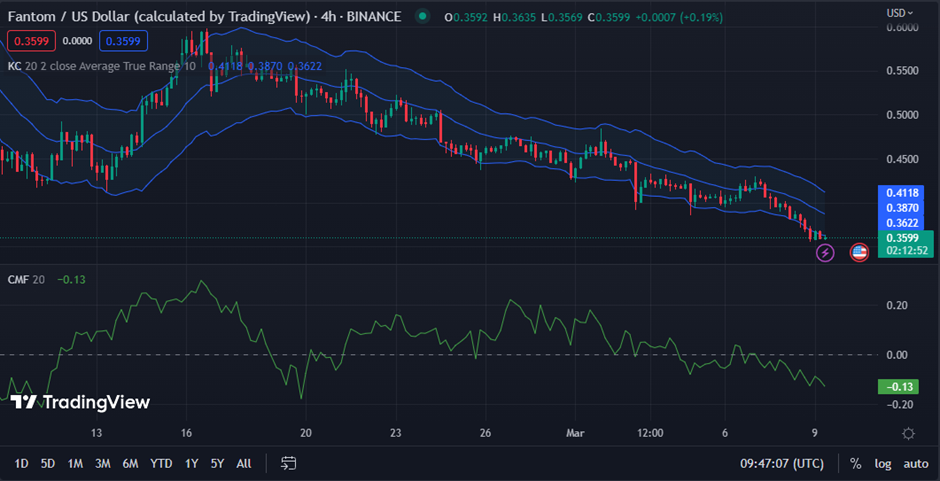
Lower volatility for FTM may be on the horizon as the Keltner Channel bands move south and contract, with the upper band at 0.4119 and the lower bar at 0.3623 on the FTM price chart.
Price action has broken below the lower band, indicating a possible buying opportunity for traders who believe the price will recover from this consolidation phase.
A reading of -0.12 on the Chaikin Money Flow (CMF) indicates that selling pressure is still present in the market, suggesting that the anticipated rebound may not be sustainable.
This anticipation is because a negative trending CMF indicates that money flows out of the market. This motion suggests that investors are selling off their positions, which could lead to further price declines.
FTM faces bearish pressure as market capitalization falls, but signs of resilience and potential recovery suggest a buying opportunity for traders.
Disclaimer: The views, opinions, and information shared in this price prediction are published in good faith. Readers must do their research and due diligence. Any action taken by the reader is strictly at their own risk. Coin Edition and its affiliates will not be liable for direct or indirect damage or loss.
Disclaimer: The information presented in this article is for informational and educational purposes only. The article does not constitute financial advice or advice of any kind. Coin Edition is not responsible for any losses incurred as a result of the utilization of content, products, or services mentioned. Readers are advised to exercise caution before taking any action related to the company.


