


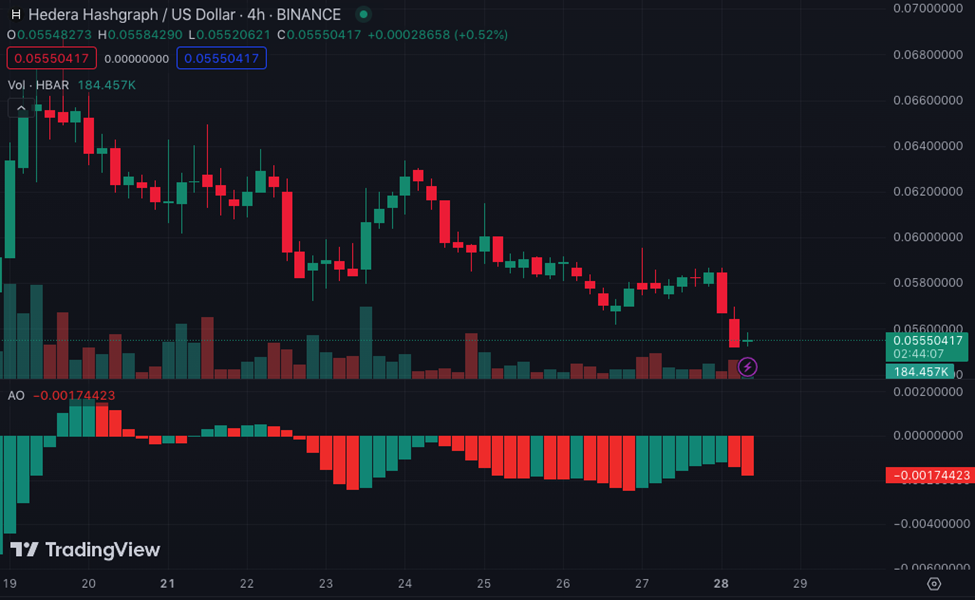
- HBAR may fall below $0.55 as the AO indicated a bearish momentum for the token.
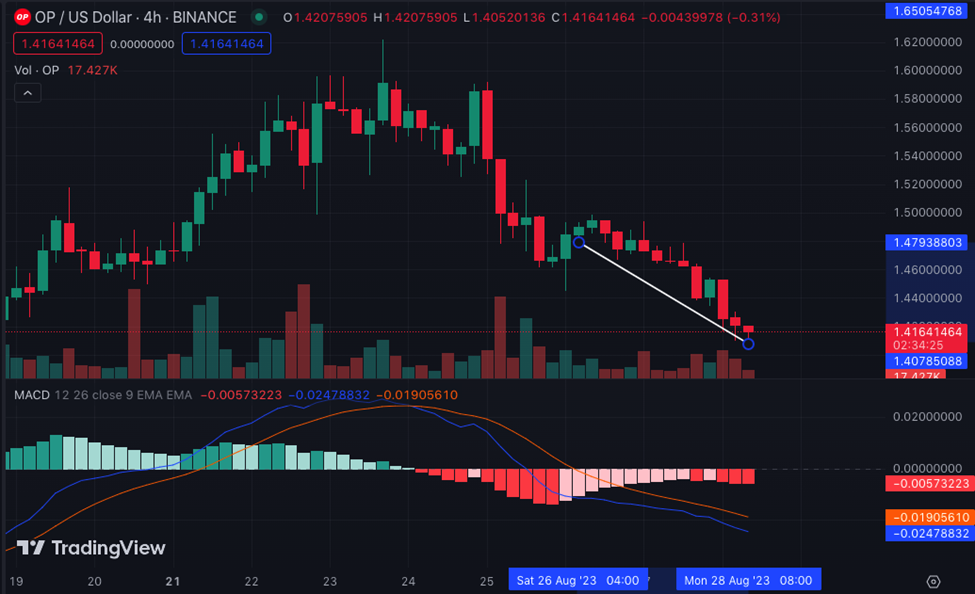
- OP had a bearish divergence, implying a downward momentum that could send it to $1.20.
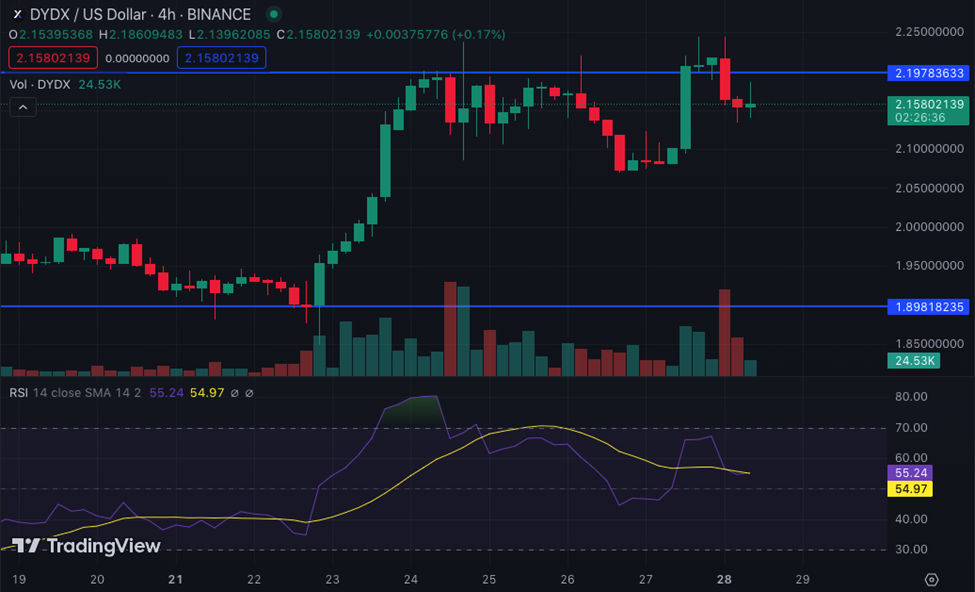
- With a relatively fair RSI, DYDX has the tendency to consolidate around $2.15.
Hedera (HBAR), Optimism (OP), and dYdX (DYDX) are all gearing up for another round of token unlocks. According to on-chain tracking platform Token Unlocks data, $34.31 million worth of OP, representing 3.37% of its total supply would be released on August 30.
Also, 3.48% of HBAR’s total supply which amounts to $63.93 million would go into circulation on August 31. Lastly, DYDX would release 3.76% of its total supply this same week. Token unlocks refer to the release of previously restricted assets into circulation, so as to increase liquidity and potentially influence trading volumes.
As a recurring event in the cryptocurrency market, unlocks have often led to plunging prices for tokens affected, traders and investors may be watching for any potential effects on the token prices and the overall market sentiment as these projects prepare to release additional tokens into circulation.
Hedera (HBAR)
For HBAR, its performance lately has been different from what it was 30 days ago. According to CoinMarketCap, HBAR’s price fell by 11.80% in the last seven days due to increased profit-taking.
From the 4-hour HBAR/USD chart, the momentum may not change when the tokens are unlocked. This is because the Awesome Oscillator (AO) was -0.0017.
Basically, a negative reading implies that the 34-period Moving Average (MA) was greater than the 5-period MA. Hence, HBAR has a good potential to remain bearish. So, the price could fall below $0.55
Optimism (OP)
In OP’s case, the Moving Average Convergence Divergence (MACD) was down to -0.005. The negative MACD implies that the 12-day EMA had diverged below the 26-day EMA. Thus, the downward momentum was increasing.
Additionally, OP’s market structure was bearish, as it lost hold on support from $1.46 to $1.41. If OP loses its hold on the $1.41, then it’s only a matter of time before the token plunges to $1.20.
dYdX(DYDX)
Unlike OP and HBAR, DYDX’s market structure was bullish between $1.89 till it faced rejection at $2.19. While there was some sort of selling pressure afterward, DYDX rose again to $2.19. However, at press time, DYDX had fallen to $2.15.
Furthermore, the Relative Strength Index (RSI) had decreased to 55.63. The slump indicates that buying momentum has reduced. So, it is likely that DYDX will consolidate or face increased selling pressure when its tokens are unlocked.
In conclusion, HBAR, DYDX, and OP have only a slight chance of an upward trajectory. While the increase in circulation may plunge the tokens, stability could within a short period.
Disclaimer: The views, opinions, and information shared in this price prediction are published in good faith. Readers must do their research and due diligence. Any action taken by the reader is strictly at their own risk. Coin Edition and its affiliates will not be liable for direct or indirect damage or loss
Disclaimer: The information presented in this article is for informational and educational purposes only. The article does not constitute financial advice or advice of any kind. Coin Edition is not responsible for any losses incurred as a result of the utilization of content, products, or services mentioned. Readers are advised to exercise caution before taking any action related to the company.


