


- Hedera Hashgraph token saw a gradual uptrend in the last 24 hours.
- The HBAR/USD token is facing strong resistance at the $0.06101 level.
- Further gains can be expected if the broader market continues to rally.
The Hedera Hashgraph token, HBAR, has seen a much-needed recovery today as it rises by over 3.14%, trading at $0.06057 at press time. This comes as the entire cryptocurrency market experiences a broad-based rally following the recent dip.
HBAR has been under a strong upward movement in the last 24 hours, moving from an intra-day low of $0.05890 to its current level of $0.06057. The token is currently facing strong resistance at the $0.06101 level, and a break above this level could see further gains for HBAR in the next few hours.
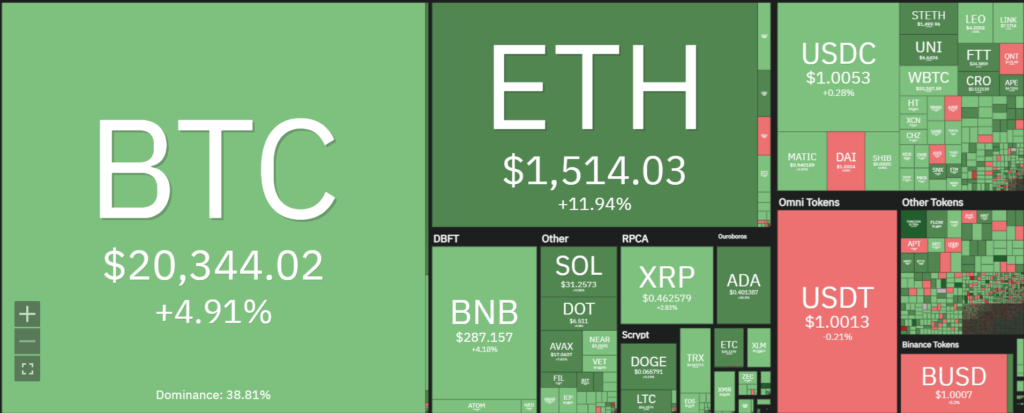
The overall cryptocurrency market has also been on an uptrend in the last 24 hours, with ETH soaring by more than 11.94% and Bitcoin climbing by over 4.91%. This positive trend is expected to bode well for HBAR as well, potentially leading to further gains in the near future.
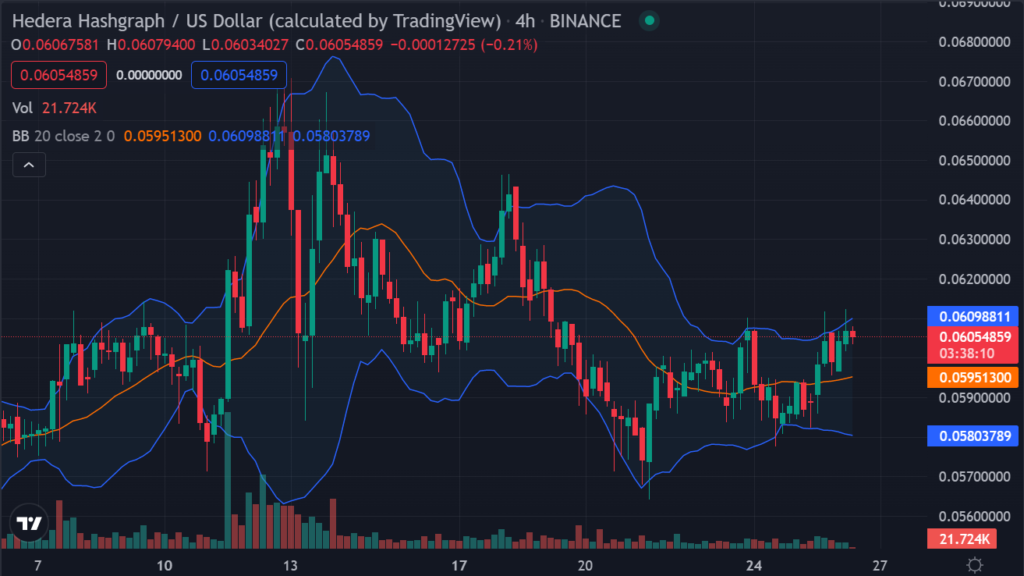
The HBAR/USD pair is currently well positioned above the moving average lines on the 4-hour chart, indicating that it is in a bullish trend in the short term. Traders may want to keep an eye on the $0.06101 resistance level and consider opening long positions if it is successfully breached.
The market volatility for HBAR/USD pair is presently high, as indicated by the widening Bollinger Bands. This shows that the market might continue to see some price swings in the near term.
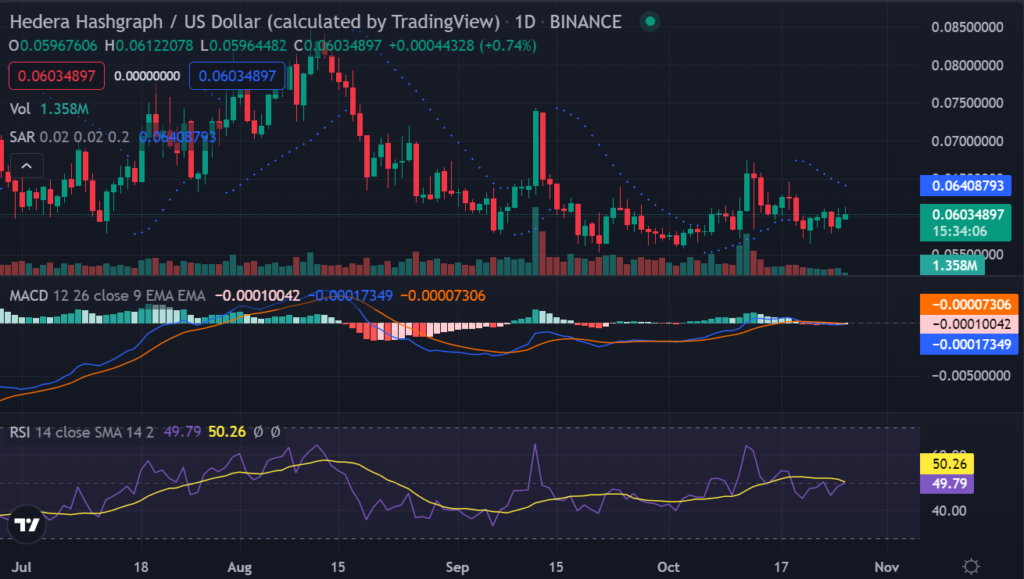
Further technical analysis and developments indicate a positive outlook for the HBAR token in the daily chart as the token is trading above the moving average lines, indicating a bullish trend in the long term as well. For instance, the EMA ribbon is showing convergence, a bullish sign for the token’s future price movement.
The dots of the Parabolic SAR indicator are well below the price candles, indicating that there is currently a bullish trend for HBAR, while the Relative Strength Index (RSI) is hovering around the 65 mark, indicating that it is currently approaching the overbought level. The Moving Average Divergence Convergence MACD line has crossed above the signal line, indicating a bullish trend in the near term.
Overall, Hedera Hashgraph seems to be enjoying some much-needed recovery amid the broader market rally, and technical indicators point toward potentially further gains in the near term. Also, the token has sought firm support at the $0.05890 level and could potentially break above the $0.06101 resistance level in the coming hours. It remains to be seen if HBAR can sustain this upward momentum. Still, traders may want to keep an eye on this altcoin and consider opening long positions if it continues to show positive developments.
Disclaimer: The views and opinions, as well as all the information shared in this price analysis, are published in good faith. Readers must do their own research and due diligence. Any action taken by the reader is strictly at their own risk. Coin Edition and its affiliates will not be held liable for any direct or indirect damage or loss.
Disclaimer: The information presented in this article is for informational and educational purposes only. The article does not constitute financial advice or advice of any kind. Coin Edition is not responsible for any losses incurred as a result of the utilization of content, products, or services mentioned. Readers are advised to exercise caution before taking any action related to the company.
 Price Prediction 2026-2030: Will TRX Hit $0.50 Soon?")
 Price Prediction 2026-2050: Will HYPE Hit $100 Soon?")


: What Happens If You Use an Unlicensed Platform?")