


- WIF, JUP, LTC, and RNDR registered price jumps in the last seven days.
- WIF and JUP have a strong correlation with the Supertrend indicating more upside.
- While LTC’s bullish thesis remained present, RNDR might trade sideways.
Prices of many cryptocurrencies have been hitting weekly highs recently, and the likes of dogwifhat (WIF), Jupiter (JUP), Litecoin (LTC), and Render (RNDR) have not been left out.
In the last seven days, WIF’s price has increased by an incredible 107%. JUP, like WIF, jumped by 26.07%, and AI-themed RNDR registered a 3.68% increase. Lastly, LTC rose by 23.91%.
In this piece, Coin Edtion considers how the price actions of these cryptocurrencies compare with each other. First, the analysis would focus on WIF against JUP since they were both built on Solana. Next up is an in-depth analysis of LTC and RNDR.
WIF vs. JUP
At press time, WIF changed hands at $4.59. JUP, on the other hand, was $1.53. From the 4-hour comparative chart, there seems to be a strong correlation between WIF’s price action and JUP’s.
For instance, when WIF tumbled between March 21 and 23, JUP also did the same. It was a similar situation on March 30 as both tokens rallied to new highs.
Going forward, it looks like the connection might not remain the same. This was because of the indication shown by the Supertrend. Despite the price jumps JUP and WIF have had, the Supertrend did not identify a sell signal that could push back the upswing.
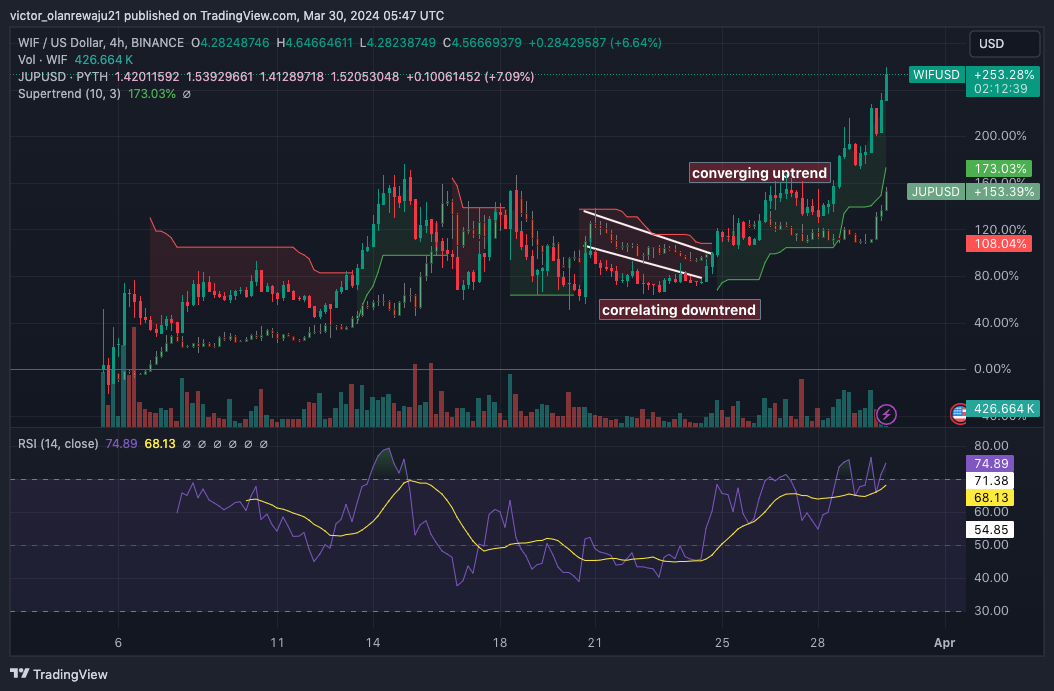
Hence, it is likely that the prices might climb further. However, the Relative Strength Index (RSI) hit the overbought region, suggesting that a retracement could be on the cards. If WIF or JUP retraces, there is a chance that a harder pump might appear once buying pressure returns.
LTC vs. RNDR
The 4-hour analysis of LTC/USD against RNDR did not produce a similar result to the one mentioned above. Unlike WIF and JUP, the price action of LTC differed from RNDR.
For example, RNDR struggled to resist a decline on March 29. But it was around the same period that spotted support that triggered an engulfing candle that cleared the overhead resistance and hit $103.96.
A look at the Exponential Moving Average (EMA) displayed a golden cross on the LTC/USD chart. At press time, the 20 EMA (blue) had crossed over the 50 EMA (yellow), suggesting a bullish trend for the coin.
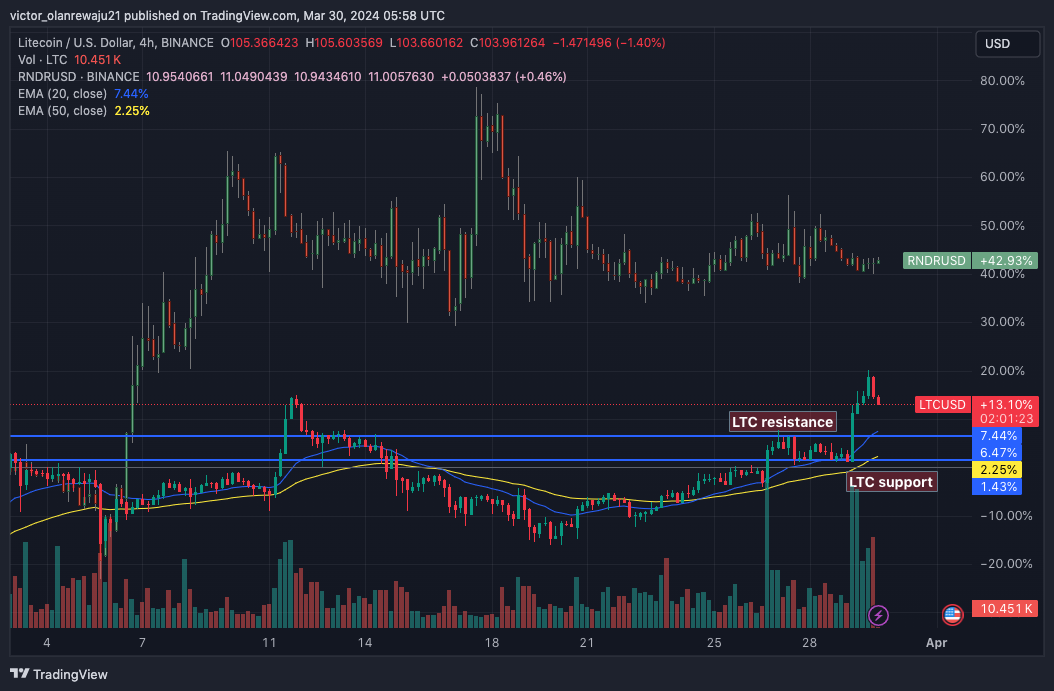
However, traders need to watch out. If Litecoin’s price drops below the 20 EMA, the bullish bias might be invalidated. For Render, it does not seem like the value would produce a significant jump in the short term as it might trade sideways between $10.83 and $11.12.
Disclaimer: The information presented in this article is for informational and educational purposes only. The article does not constitute financial advice or advice of any kind. Coin Edition is not responsible for any losses incurred as a result of the utilization of content, products, or services mentioned. Readers are advised to exercise caution before taking any action related to the company.


