 Price Prediction 2023-2030: Will IDEX Price Hit $0.3 Soon?")
- Bullish Idex (IDEX) price prediction ranges from $0.03678 to $0.291
- Analysis suggests that the IDEX price might reach above $0.3
- The IDEX bearish market price prediction for 2023 is $0.036
Table of contents
- Idex (IDEX) Market Overview
- What is Idex (IDEX)?
- IDEX Current Market Status
- IDEX Price Analysis 2023
- Idex Price Prediction 2023-2030 Overview
- Idex Price Prediction 2023
- Idex Price Prediction 2024
- Idex Price Prediction 2025
- Idex Price Prediction 2026
- Idex Price Prediction 2027
- Idex Price Prediction 2028
- Idex Price Prediction 2029
- Idex Price Prediction 2030
- Idex Price Prediction 2040
- Idex Price Prediction 2050
- Conclusion
- FAQ
Idex (IDEX) Market Overview
| 🪙 Name | Aurora DAO |
| 💱 Symbol | AURA |
| 🏅 Rank | # |
| 💲 Price | $0 |
| 📊 Price Change (1h) | 0 % |
| 📊 Price Change (24h) | 0 % |
| 📊 Price Change (7d) | 2.26 % |
| 💵 Market Cap | $ |
| 💸 Circulating Supply | 193945163.26533 AURA |
| 💰 Total Supply | 1000000000 AURA |
Aurora DAO (AURA) is currently trading at $0 and sits at number # on CoinMarketCap in terms of market capitalization. There are 193945163.26533 AURA coins currently in circulation, bringing the total market cap to $.
Over the past 24 hours, Aurora DAO has decreased by 0%. Looking at the last week, the coin is up by 2.26%.
What is Idex (IDEX)?
Idex claims to be the first layer-3 derivatives exchange. It utilizes a hybrid model that combines the traditional order book and an Automated Market Maker (AMM).
As such, it blends the performance and features of a traditional order book model with the security and liquidity of an AMM. Furthermore, Idex takes an innovative approach to decentralized exchanges by combining an off-chain trading engine with an on-chain trade settlement. Users benefit from that in several ways.
To execute trades, Idex uses an off-chain trading engine that matches the performance of centralized exchanges and guarantees sequencing. Trades are processed in an off-chain order book. Only when a trade is matched and executed, the transaction is settled on-chain.
In doing so, users benefit from not having to pay additional network costs for placing and canceling orders. Furthermore, placements are processed in real time, enabling more advanced trading and market-making strategies like stop-loss, post-only, and fill-or-kill.
IDEX Current Market Status
The maximum supply of Idex (IDEX) is unknown, while its circulating supply is 673,858,614 IDEX coins, according to CoinMarketCap. At the time of writing, IDEX is trading at $0.0885 representing 24 hours decrease of 14.180%. The trading volume of IDEX in the past 24 hours is $247,204,847 which represents a 123.59% increase.
Some top cryptocurrency exchanges for trading Idex (IDEX) are Binance, Coinbase, Huobi Global, Gate.io, Uniswap v2, and Kraken.
Now that you know what IDEX is and its current market status, we shall discuss the price analysis of Idex (IDEX) for 2023.
IDEX Price Analysis 2023
Will the IDEX blockchain’s most recent improvements, additions, and modifications help its price rise? Moreover, will the changes in the payment and crypto industry affect IDEX’s sentiment over time? Read more to find out about IDEX’s 2023 price analysis.
Idex Price Analysis – Bollinger Bands
The Bollinger bands are a type of price envelope developed by John Bollinger. It gives a range with an upper and lower limit for the price to fluctuate. The Bollinger bands work on the principle of standard deviation and period (time).
The upper band as shown in the chart is calculated by adding two times the standard deviation to the Simple Moving Average while the lower band is calculated by subtracting two times the standard deviation from the Simple Moving Average.
When this setup is used in a cryptocurrency chart, we could expect the price of the cryptocurrency to abide within the upper and lower bounds of the Bollinger bands 95% of the time.
The above thesis is derived from an Empirical law also known as the three-sigma rule or the 68-95-99.7 which states that almost all observed data for a normal distribution (normal scattering of data) will fall within three standard deviations.
As such for a data set that follows a normal distribution, 68% of data will fall within 1 standard deviation of the mean, while 95% of data for the normal distribution will fall within 2 standard deviations of the mean and 99.7% of data will fall within 3 standard deviations of the mean.
Hence, as the Bollinger bands are calculated using two standard deviations, we could expect IDEX to abide within the Bollinger bands 95% of the time. (i.e whenever the cryptocurrency touched the upper band, the chances of it coming down are 95%.). This concept applies vice-versa as well.
Moreover, the sections highlighted by red rectangles show how the bands expand and contract. When the bands widen, we could expect more volatility, and when the bands contract, it denotes less volatility. Currently, the bands are opening up after being in a closed position.
This could indicate that there is going to be more volatility for IDEX in the future. Moreover, IDEX is forming candlesticks above the upper band. This shows that IDEX is extremely overbought and the market could correct the price. As such, IDEX could retrace and decrease in value and fall back between the upper and lower bands. Traders looking to short should keep a watchful eye.
Notably, the Bollinger Band behaves very closely with the Keltner channel. For instance, if you were to use both the Bollinger bands and Keltner channel indicators for a cryptocurrency, you would see that almost most of the time both indicators overlap.
However, the only difference between with Bollinger band and the Keltner channel is that the Bollinger bands use Standard Deviation while the Keltner channel uses Average True Range for calculating its bands which are the top and bottom limits.
Idex Price Analysis – Relative Strength Index
The Relative Strength Index is an indicator that is used to find out whether the price of a security is overvalued or undervalued. As per its name, RSI indicators help determine how the security is doing at present, relative to its previous price.
Moreover, it has a signal line which is a Simple Moving Average (SMA) that acts as a yardstick or reference to the RSI line. Hence, whenever the RSI line is above the SMA it is considered bullish and if it’s below the SMA then it is bearish.
When considering the first green rectangle from the left of the chart below we can see that the RSI line (purple) is below the Signal line (yellow). As such, IDEX is bearish or losing value. Therefore it is reaching lower lows as shown in the chart.
The second green rectangle shows that the RSI is above the signal. Hence, IDEX is bullish as it is making higher highs.
Currently, the RSI of IDEX is in the overbought region with a value of 81.50 which is above the Signal line. However, the RSI is still looking into the overbought region, hence, we could expect the prices of IDEX to increase and reside in the overbought.
To deduce whether a cryptocurrency is bearish or bullish, the RSI compares the gains of the securities against the losses it made in the past. This ratio of gains against the losses is then deducted from the 100.
If the answer is equal to or less than 30, then we call that the price of the security is in the oversold region.
This means that many are selling the security in the market, and as such the security is undervalued. Moreover, as per the Supply-demand curve theory, the price is supposed to drop when there is an increase in supply.
If the answer is equal to or greater than 70 then the security is overbought as many are buying. Since many want to buy the security the demand increases which intuitively increases the prices.
Additionally, the RSI could be used to determine how strong a trend is. For instance, when a cryptocurrency is bullish or reaching higher highs, then the RSI line also should be making higher highs in unison.
For instance, if the RSI is making lower highs when the cryptocurrency is making higher highs, then we may say that although the token/coin is on a bullish trend it is losing value. As such, there could be a trend reversal in the future.
However, the RSI could also give false alarms for breakouts. Although we may expect, the prices to retrace if it goes to the oversold or overbought region, the prices also can stay in the oversold or overbought region for an extended period. As such, traders should be wary of it and let the market saturate before making vital decisions.
Idex Price Analysis – Moving Average
The Exponential Moving averages are quite similar to the simple moving averages (SMA). However, the SMA equally distributes down all values whereas the Exponential Moving Average gives more weightage to the current prices. Since SMA undermines the weightage of the present price, the EMA is used in price movements.
The 200-day MA is considered to be the long-term moving average while the 50-day MA is considered the short-term moving average in trading. Based on how these two lines behave, the strength of the cryptocurrency or the trend can be determined on average.
In particular, when the short-term moving average (50-day MA) approaches the long-term moving average (200-day MA) from below and crosses it, we call it a Golden Cross.
Contrastingly, when the short-term moving average crosses the long-term moving average from above then, a death cross occurs.
Usually, when a Golden Cross occurs, the prices of the cryptocurrency will shoot up drastically, but when there’s a Death Cross, the prices will crash.
Whenever the price of cryptocurrency is above the 50-day or 200-day MA, or above both we may say that the coin is bullish (red rectangle). Contrastingly, if the token is below the 50-day or 200-day, or below both, then we could call it bearish (Green triangle section).
After briefly rebounding on the 200-day MA, IDEX ricocheted off of the 50-day MA which is
above the 200-day MA. Thereafter IDEX has risen almost exponentially.
As highlighted by the circles, we could see that IDEX tested the 50-day MA on numerous occasions but wasn’t able to break above it. However, the dawn of 2023 brought some momentum to IDEX. This helped the token break the 50-day MA and thereafter test and break the 200-day MA.
Currently, both Moving Averages are facing upwards, this could have been the result of the exponential increase in the recent past.
Idex Price Analysis – Rate of Change (ROC)
The Rate of Change Indicator is a momentum oscillator, that measures the change of the current price against the past price a few number of periods ago, in percentage. As long as the price is rising ROC will be positive. But, the ROC indicator will reach the negative zone when the prices reduce. Increasing values in either direction, positive or negative, indicate increasing momentum and moving back toward zero indicates diminishing momentum.
Moreover, the equation for ROC is as follows: ROC = [(Today’s Closing Price – Closing Price n periods ago) / Closing Price n periods ago] x 100.
Unlike the RSI, ROC has no set overbought or oversold regions, it rather depends on a trader’s discretion. Traders often tend to find the areas in the positive and negative zones where the trend changes have happened in regularity. Based on this they could mark their bounds for overbought and oversold regions.
ROC could also be used as a divergence indicator that signals a possible upcoming trend change. Divergence occurs when the price of a stock or asset moves in one direction while its ROC moves in the opposite direction.
For example, if a stock’s price is rising over a period of time and registering higher highs while the ROC is progressively moving lower, or making lower highs, then the ROC is indicating bearish divergence from price, which signals a possible trend change to the downside. The same concept applies if the price is moving down and ROC is moving higher.
When considering the chart we could that although the IDEX was making higher highs, the ROC indicator was making lower highs, hence the trend changed. Moreover, IDEX’s extreme overbought regions are marked as overbought regions 1 and 2, prime places where trend reversals happened in regularity. Similarly, the oversold regions too are marked based on trend reversal.
Currently, as the ROC indicates IDEX is at 67.89, it is extremely overbought, hence, there could possibly be a trend reversal.
Idex Price Prediction 2023-2030 Overview
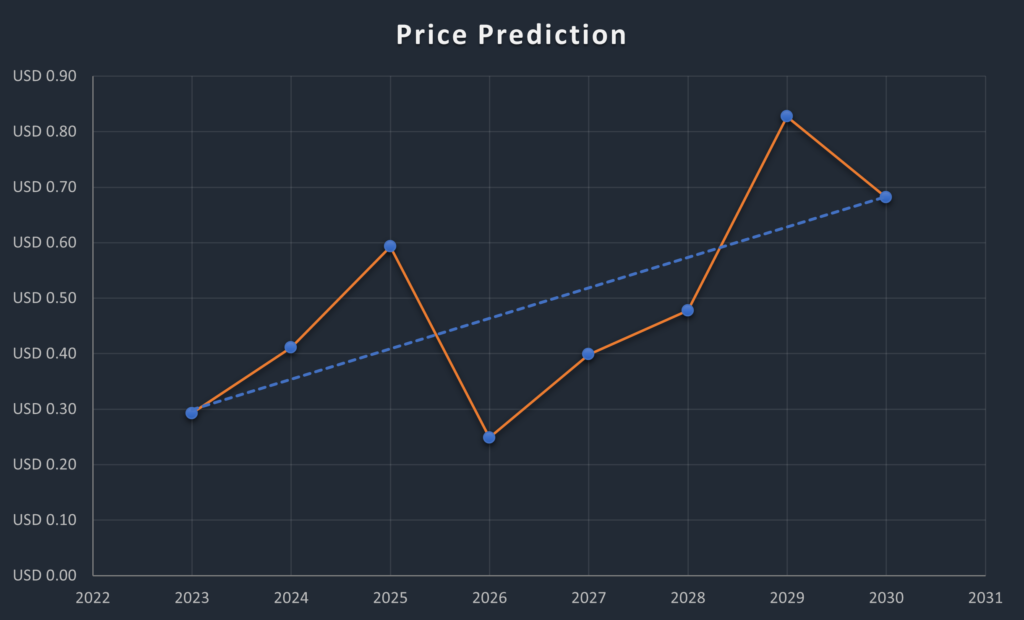
| Year | Minimum Price | Average Price | Maximum Price |
| 2023 | $0.2812 | $0.2923 | $0.3012 |
| 2024 | $0.3890 | $0.4112 | $0.4512 |
| 2025 | $0.5866 | $0.5928 | $0.6125 |
| 2026 | $0.2311 | $0.2484 | $0.2516 |
| 2027 | $0.3922 | $0.4015 | $0.4116 |
| 2028 | $0.4355 | $0.4777 | $0.6825 |
| 2029 | $0.7122 | $0.8273 | $0.9220 |
| 2030 | $0.6715 | $0.6802 | $0.7015 |
| 2040 | $1.1259 | $1.2315 | $1.5923 |
| 2050 | $1.6258 | $1.7800 | $1.9825 |
Idex Price Prediction 2023
When considering the chart above we could see that IDEX formed the Adam and Eve pattern. Currently, as IDEX has broken above the resistance line, we could expect it to retest the line by the book. Moreover, IDEX has touched the upper Bollinger band, hence, we could expect the prices to retrace. During this retracement phase, we could expect IDEX to test the Resistance line at $0.085.
After retesting the Resistance line, IDEX could surge to Resistance 2 at $0.291 as shown by the yellow trajectory line. However, there also lies the possibility that IDEX could rebound on the Resistance line and test Resistance 1 at $0.205.
However, during the phase of retesting the resistance line, if the bears take over, then IDEX may look to land on Support 1 at $0.0603. Based on past behavior, Support 1 may not be able to hold up IDEX. If this is the case IDEX could fall to Support 2 at $0.036.
Idex Price Prediction – Resistance and Support Levels
The above chart shows how IDEX descended from Resistance 4 to its present residing zone. Although IDEX was falling quite abruptly in October 2021, we could see that it had some consolidation between Resistance 1 and Resistance 3. However, the bulls were not able to control the bears for too long.
The beginning of 2022 brought about another wave of collapse that made IDEX fall below Resistance 1 and reach out for assistance from Support 1. Since June 2022, IDEX has been rebounding on Support 1. Compared to the previous years, there seem to be very few vertical movements for IDEX.
Idex Price Prediction 2024
There will be Bitcoin halving in 2024, and hence we should expect a positive trend in the market due to user sentiments and the quest by investors to accumulate more of the coin. Since the Bitcoin trend affects the direction of trade of other cryptocurrencies, we could expect Idex to trade at a price not below $0.4112 by the end of 2024.
Idex Price Prediction 2025
Idex may still experience the after-effects of the Bitcoin halving and is expected to trade above its 2024 price. Many trade analysts speculate that BTC halving could create a huge impact on the crypto market. Moreover, similar to many altcoins, Idex will continue to rise in 2025 forming new resistance levels. It is expected that Idex would trade beyond the $0.5928 level.
Idex Price Prediction 2026
It is expected that after a long period of bull run, the bears would come into power and start negatively impacting the cryptocurrencies. During this bearish sentiment, Idex could tumble into its support regions. During this period of price correction, Idex could lose momentum and be a little below its 2025 price. As such it could be trading at $0.2484 by 2026.
Idex Price Prediction 2027
Naturally, traders expect a bullish market sentiment after the crypto industry was affected negatively by the bears’ claw. Moreover, the build-up to the next Bitcoin halving in 2028 could evoke excitement in traders. As such we could expect Idex to trade at around $0.4015 by the end of 2027.
Idex Price Prediction 2028
As the crypto community’s hope will be re-ignited looking forward to Bitcoin halving like many altcoins, Idex will continue to form new higher highs and is expected to move in an upward trajectory. Hence, Idex would be trading at $0.4777 after experiencing a massive surge by the end of 2028.
Idex Price Prediction 2029
2029 is expected to be another bull run due to the aftermath of the BTC halving. However, traders speculate that the crypto market would gradually become stable by this year. In tandem with the stable market sentiment and the slight price surge expected after the aftermath, Idex could be trading at $0.8273 by the end of 2029.
Idex Price Prediction 2030
After witnessing a bullish run in the market, Idex and many altcoins would show signs of consolidation and might trade sideways and move downwards for some time while experiencing minor spikes. Therefore, by the end of 2030, Idex could be trading at $0.6802.
Idex Price Prediction 2040
The long-term forecast for Idex indicates that this altcoin could reach a new all-time high(ATH). This would be one of the key moments as HODLERS may expect to sell some of their tokens at the ATH point.
However, Idex may face a slight fall before starting its upward journey once again. It is expected that the average price of Idex could reach $1.2315 by 2040.
Idex Price Prediction 2050
The community believes that there will be widespread adoption of cryptocurrencies, which could maintain gradual bullish gains. By the end of 2050, if the bullish momentum is maintained, DOT could surpass the resistance level of $1.7800
Conclusion
As said above, the price of Idex may even reach above $0.2923 if investors have decided that the cryptocurrency is a good investment, along with mainstream cryptocurrencies.
FAQ
Idex claims to be the first layer-3 derivatives exchange. It utilizes a hybrid model that combines the traditional order book and an Automated Market Maker.
IDEX can be traded on many exchanges like other digital assets in the crypto world. Binance, Coinbase, Kraken, and Uniswap V2 are currently the most popular cryptocurrency exchanges for trading Idex.
IDEX has a possibility of surpassing its present all-time high (ATH) price of $0.9745 in 2021. However, due to the positive sentiments of its investors, this could be reached by the end of 2040.
IDEX is one of the few cryptocurrencies that has retained its bullish momentum in the past seven days. If this momentum is maintained, IDEX might reach $0.3 soon after its breaks the Resistance 1 level.
IDEX has been one of the most suitable investments in the crypto space. It has been rising exponentially, hence, traders may be allured to invest in IDEX.
IDEX has a present all-time low price of $0.008559.
Idex was launched by CEO and co-founder Alex Wearn and his brother and COO Phil Wearn.
Idex maximum supply is unavailable.
Idex was launched in 2017.
Idex can be stored in a cold wallet, hot wallet, or exchange wallet.
IDEX is expected to reach $ 0.4112 by 2024.
IDEXis expected to reach $0.5928 by 2025.
IDEX is expected to reach $0.2484 by 2026.
IDEX is expected to reach $0.4015 by 2027.
IDEX is expected to reach $0.4777 by 2028.
IDEX is expected to reach $0.8273 by 2029.
IDEX is expected to reach $0.6802 by 2030.
IDEX is expected to reach $1.2315 by 2040.
IDEX is expected to reach $1.7800 by 2050.
Disclaimer: The views and opinions, as well as all the information shared in this price prediction, are published in good faith. Readers must do their research and due diligence. Any action taken by the reader is strictly at their own risk. Coin Edition and its affiliates will not be held liable for any direct or indirect damage or loss.
Disclaimer: The information presented in this article is for informational and educational purposes only. The article does not constitute financial advice or advice of any kind. Coin Edition is not responsible for any losses incurred as a result of the utilization of content, products, or services mentioned. Readers are advised to exercise caution before taking any action related to the company.


")

