
- SHIB confirmed the breakout above $0.000008 after some slips on several occasions.
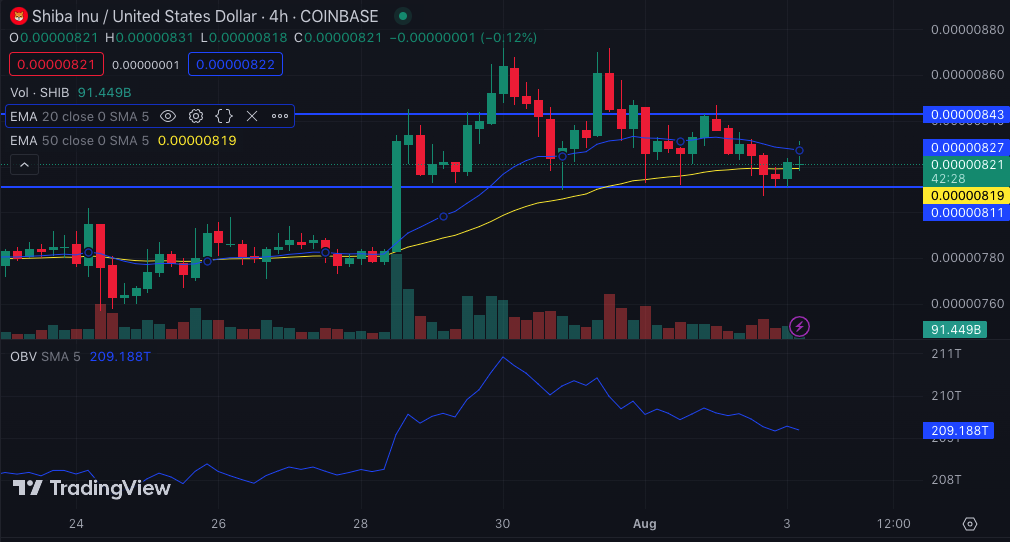
- If the OBV continues rising and accumulation reigns, SHIB may reach $0.000009.
- The AO needs to move into the positive territory for an uptrend confirmation.
Since Shiba Inu (SHIB) dropped to $0.000006 in June, crossing the $0.000008 resistance has been difficult. However, after several failed attempts, SHIB has broken the psychological resistance five times in the last two weeks.
The first break happened on July 15 when SHIB crossed into $0.0000083. Unfortunately, that hike was short-lived as the token dropped to $0.0000077 three days later. But the selling pressure experienced on July 15 and 18 could not halt SHIB’s rise to $0.0000086 on July 31, which was a confirmation of the breakout.
Oftentimes, when an asset breaches this level, it indicates the start of a new trend. From CoinMarketCap’s data, SHIB has registered a 7.25% increase in the last 24 hours.
Accumulation Can Trigger Another Increase
According to the SHIB/USD 4-hour chart, notable profit-taking began when SHIB tapped $0.0000084. The sell orders pushed the meme down to $0.0000081 before demand appeared again at the same point.
Furthermore, the Exponential Moving Average (EMA) indicated that there’s a chance that the meme could follow up with its recently-formed bullish structure. As of this writing, the 20 EMA (blue) had crossed over the 50 EMA (yellow) since July 28.
Should the EMAs maintain this stance, SHIB may initiate another upward trajectory, possibly above $0.000009. A look at the On-Balance-Volume (OBV) showed that the indicator exhibited signs of rising in a recent flatlined period.
The OBV rising is a sign of accumulation going on and distribution falling. If the indicator continues to increase above 209.18 trillion, then SHIB may breakout and move toward $0.00001.
Be Watchful of the Movement
In terms of volatility, the Bollinger Bands (BB) showed that SHIB has maintained a constant level of volatility since July 31. However, the BB also revealed that the lower band touched SHIB at $0.00000811.
This indicates that SHIB was oversold at the said value. As a result, the trend reversed in the upward direction occurred. However, traders may need to watch out for the Awesome Oscillator (AO).
At press time, the AO was in negative territory. A positive AO indicates that the fast-moving average is more than the slow-moving average. A reading below the zero line indicates that the slow-moving average is more than the fast-moving average.
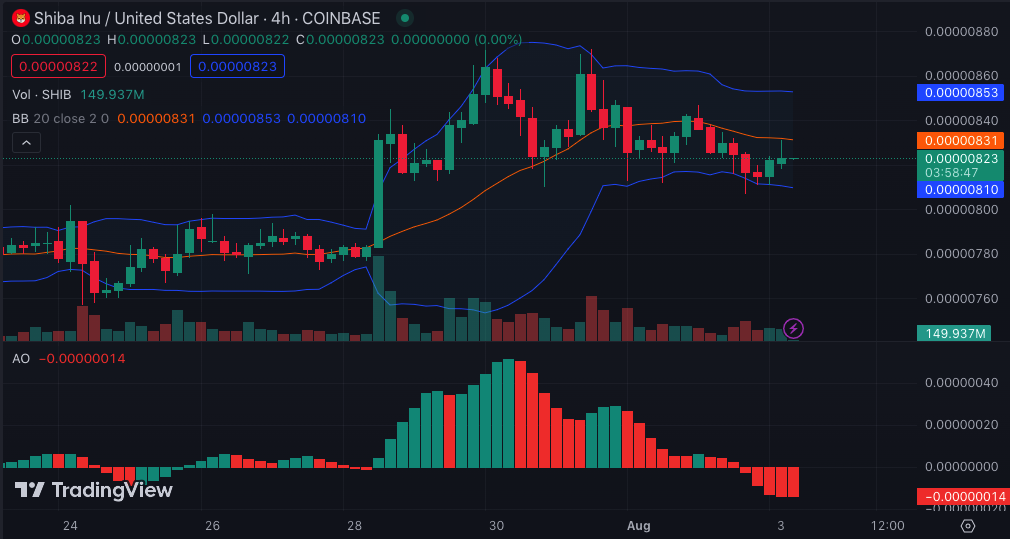
If the AO fails to leave the red region, then the potential rise to $0.000009 could be quenched. However, if buying pressure increases, the AO could rise to the zero-mid point and SHIB’s price may increase.
Disclaimer: The views, opinions, and information shared in this price prediction are published in good faith. Readers must do their research and due diligence. Any action taken by the reader is strictly at their own risk. Coin Edition and its affiliates will not be liable for direct or indirect damage or loss.
Disclaimer: The information presented in this article is for informational and educational purposes only. The article does not constitute financial advice or advice of any kind. Coin Edition is not responsible for any losses incurred as a result of the utilization of content, products, or services mentioned. Readers are advised to exercise caution before taking any action related to the company.


