


 Market Value Plummets As Bearish Pressure Intensifies")
- The Kusama token shows bearish sentiment in the past 24 hours.
- KSM/USD is currently standing at $34.17, with a loss of 1.75 percent.
- The support level for the digital asset is present at $33.73.
The Kusama price analysis reveals that the token has been on a downward trajectory after breaching the resistance level of $34.64. The KSM/USD is trading in a bearish trajectory, with the bulls striving to recapture the losses. The bearish pressure is intensifying, as the price of KSM has slipped below the $35 level. At the time of writing, the token is being exchanged at $34.17, with a loss of 1.75 percent in the past 24 hours.
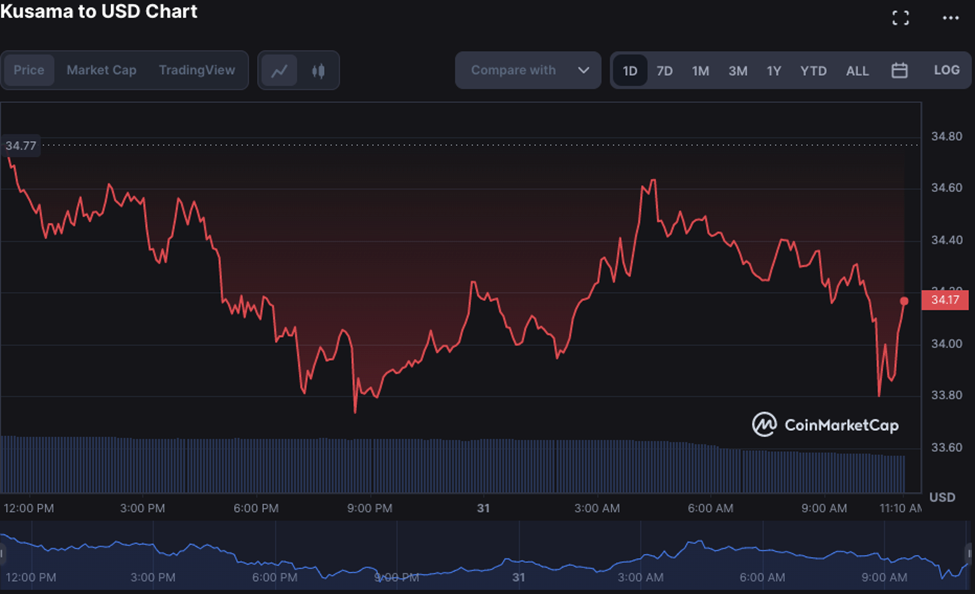
The sellers are dominating the market and have pushed KSM below the resistance zone of $34.64, making it vulnerable to more losses in the coming days. In addition, if bearish pressure continues for an extended period, then KSM could also be in line for a price correction. Looking ahead, if the bulls can regain control of the market, then KSM has a chance of climbing back up to its previous level of $35.00. However, until that happens, the token is likely to remain bearish for some time.
The market capitalization of the asset is $289,260,168 and is down by 1.18 percent in the 24-hour time frame, indicating that the sellers are dominating the market. The 24-hour trade volume of KSM has also decreased by 33.51% to $10,126,963 compared to the previous 24 hours. Additionally, the total supply has a circulation of 8,470,098 KSM tokens.
The daily technical indicators are in favor of the bears. The MACD for KSM/USD is below zero and it is showing bearish signals as its signal line has crossed underneath the MACD line. The histogram has also turned negative and is showing bearish intent. The RSI is currently standing at 49.64, indicating that the token could continue to head lower in the near future if bearish pressure persists.
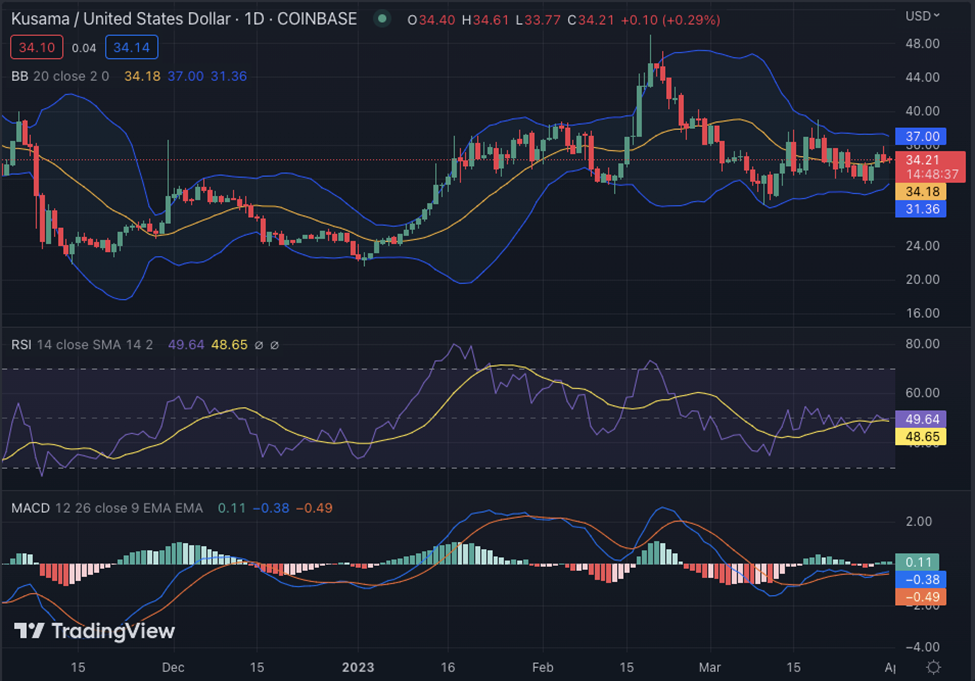
The Bollinger bands on the daily chart are exhibiting bearish pressure. The volatility is moving below the normal range and the price is trading closer to the lower Bollinger band. This indicates that there could be more losses in store for KSM if bearish pressure continues for an extended period. The upper Bollinger band is standing at $37.00, while the lower band is present at $31.36.
Overall, the market sentiment for KSM/USD remains bearish and it could be in line for more losses if bearish pressure persists. The selling pressure is likely to remain in control unless the buyers can reclaim the losses and push KSM back up toward its previous level of $35.00. The technical indicators are in favor of the bears, so KSM could remain bearish for some time.
Disclaimer: The views and opinions, as well as all the information shared in this price analysis, are published in good faith. Readers must do their own research and due diligence. Any action taken by the reader is strictly at their own risk, Coin Edition and its affiliates will not be held liable for any direct or indirect damage or loss.
Disclaimer: The information presented in this article is for informational and educational purposes only. The article does not constitute financial advice or advice of any kind. Coin Edition is not responsible for any losses incurred as a result of the utilization of content, products, or services mentioned. Readers are advised to exercise caution before taking any action related to the company.
: What Happens If You Use an Unlicensed Platform?")


