


- Sanitment reports that Litecoin and Bitcoin price ratio is up by 130%.
- The platform stated that wallet addresses holding 1000+ LTC reached the highest in two years.
- LTC trades below the 200-day MA. It could hit Resistance 1 if the bulls push through.
A market behavior analysis platform, Santiment, tweeted that the price of Bitcoin and Litecoin had been up since May. The market analysis platform stated that the price of the coins mentioned above was up due to the rise in the number of large wallet addresses accumulating these currencies.
The platform stated that the number of wallet addresses holding more than 1000+ LTC rose to 4,232, the highest in two years. Additionally, it stated that the price ratio of BTC and LTC was up by 130%.
Meanwhile, BTC has been trading within a tight price range of $16.75K to $16.85K when the two great red dips on the chart below are neglected. Since BTC has been fluctuating close to the opening market price, when BTC gained some momentum every now and then, it reached the green zone, while at other times, it dwelled in the red zone. Hence, BTC has formed green crests and red troughs.
During the past seven days, BTC hit a maximum price of $16,952 and tanked to its lowest of $16,602. As of press time, BTC is down 1.61% in the last 24 hours, trading at $16,619.41.
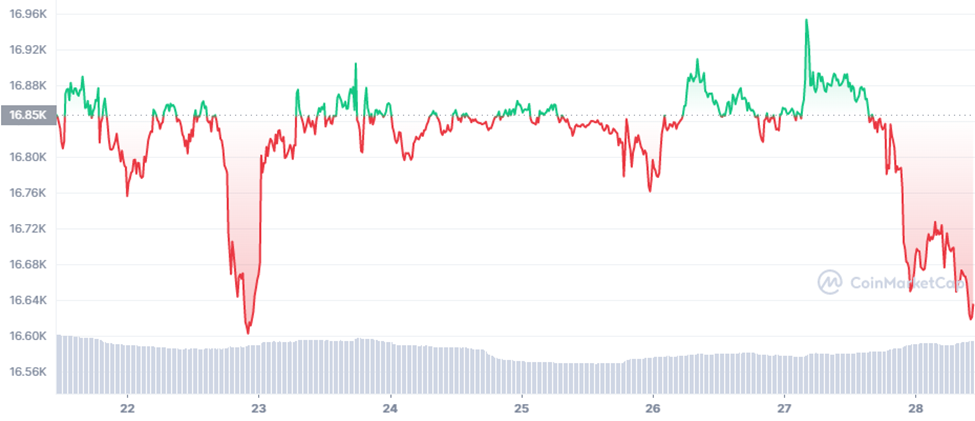
BTC/USDT 7-day Trading Chart (Source: CoinMarketCap)
Meanwhile, Litecoin is down 3.85% in the last 24 hours and is trading at $67.61 at press time.
On November 22 and 23, LTC spiked by a large margin. LTC rose from $62.23 to $83.59 within a day. LTC moved sideways from late November to mid-December, fluctuating very close to Resistance 1 (≈ $76).
However, the prices started falling on December 14. LTC fell from $78.49 to $62.57 within three days and then started consolidating.
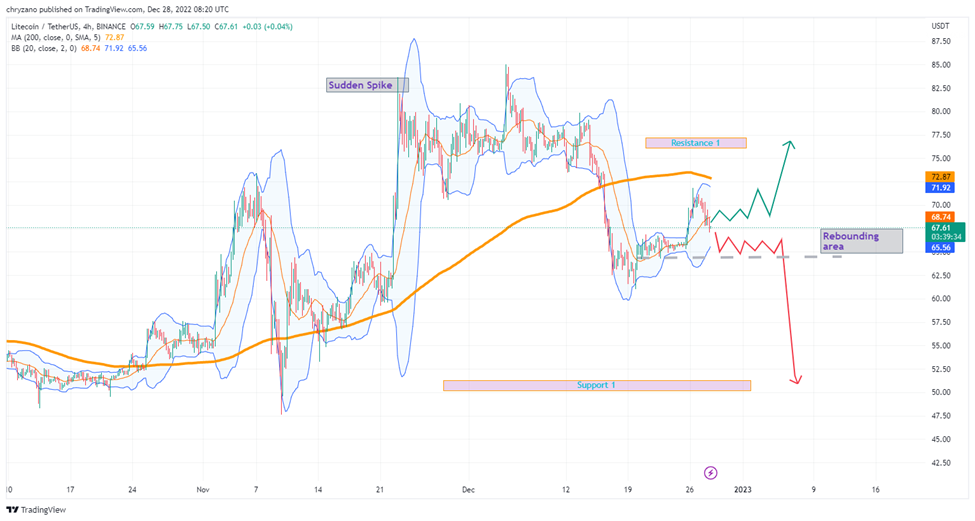
Currently, after touching the upper Bollinger band the LTC is within the Bollinger channel. LTC may return to the “Rebound Area” denoted in the chart if bears are dominant. And with more pressure from the bears, it could tank to Support 1.
However, if the bulls take over, and LTC manages to break through the 200-day MA line then it could hit Resistance 1.
Disclaimer: The views and opinions, as well as all the information shared in this price analysis, are published in good faith. Readers must do their own research and due diligence. Any action taken by the reader is strictly at their own risk, Coin Edition and its affiliates will not be held liable for any direct or indirect damage or loss.
Disclaimer: The information presented in this article is for informational and educational purposes only. The article does not constitute financial advice or advice of any kind. Coin Edition is not responsible for any losses incurred as a result of the utilization of content, products, or services mentioned. Readers are advised to exercise caution before taking any action related to the company.


