


- LUNC bulls surrender after failing to break through resistance.
- Market capitalization dips as traders flee in fear of a lengthy bear market.
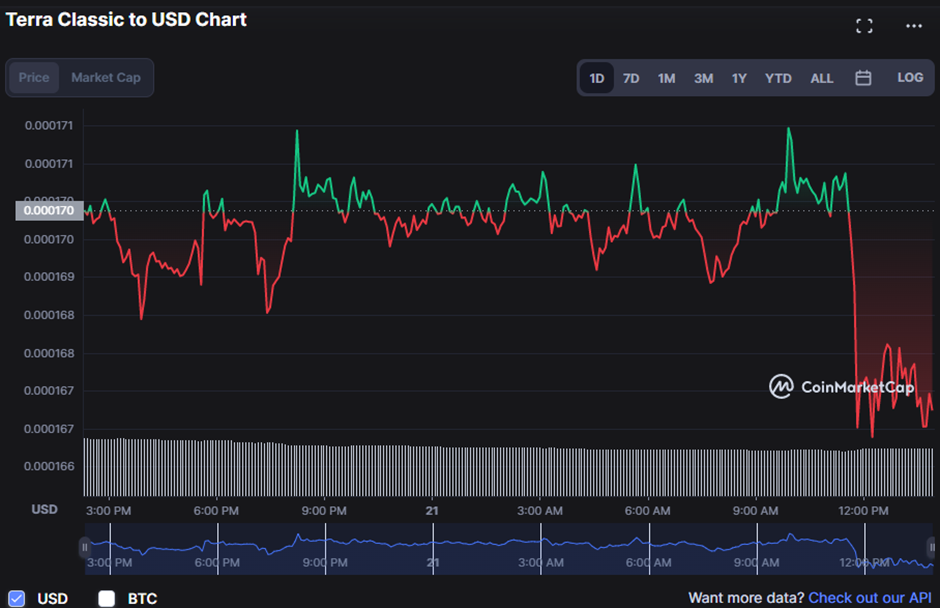
- In the past 24 hours, the price of LUNC has fluctuated between $0.000166 and $0.000171.
Throughout the past 24 hours, the Terra Classic (LUNC) has seen a fierce battle between bulls and bears, with the latter emerging victorious and sending the price down to an intraday low of $0.0001667. At the time of writing, the bears had pushed the price of LUNC down to $0.0001675, a drop of 1.41% from its previous iteration.
During the slump, the market cap decreased by 1.40% to $990,530,797, and the 24-hour trading volume decreased by 17.31% to $80,577,318. This drop shows that bears are in charge of the market trend, and if they keep pushing down, the LUNC will likely fall for a little longer.
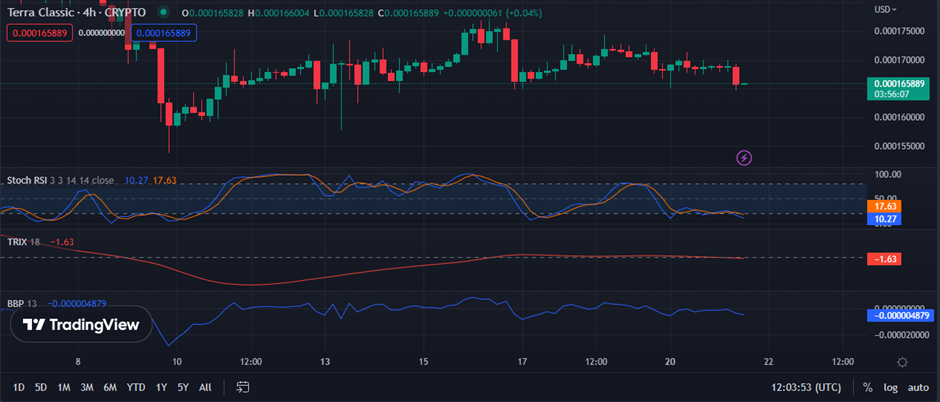
Since the Stochastic RSI is trending below its signal line with a value of 16.80, indicating that the present negative momentum in LUNC is continuing, additional price drops may be on the horizon in the immediate term. This movement implies that the market is oversold and will likely lead to a possible turnaround. Following a short period of consolidation, the market is preparing to go in an upward direction. This level is a potential buying opportunity for traders hoping to profit from the momentum reversal.
The TRIX indicator is trending in the negative zone with a value of -1.03, indicating that the market is in oversold territory and that there is a chance for the markets to reverse going ahead. However, given the present market circumstances, traders may consider this move as a possible buying opportunity in the near term.
The Bull Bear Power (BBP) trending south in the negative zone with a reading of -0.000003570 strengthens the assumption that the market is in a short-term reversal since a negative value implies more selling pressure than purchasing pressure. As a result, traders should attempt to profit from the reverse momentum and begin buying at these lower levels.
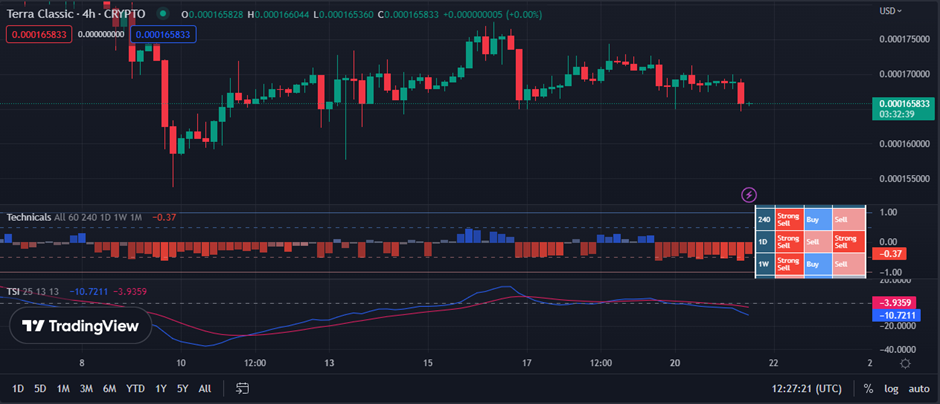
Since the Technical Ratings indicator on the LUNC price chart reflects a “strong sell” with a value of -0.51, negative sentiment looks to be in control. This display suggests that the bears have gained market control, and the negative trend will likely continue.
The True Strength Index (TSI) is going below its signal line with a reading of -10.8469, which verifies the market’s negative mood since it indicates a lot of selling pressure.
This move warns traders that the negative trend in LUNC is likely to continue until the TSI returns to and remains above its signal line. These highlight the market’s bearishness, and traders should wait to open any positions on LUNC until these technical indicators turn positive.
Indications suggest that bearish strength is building, casting doubt on the LUNC market’s ability to reverse the downward trend.
Disclaimer: The views and opinions, as well as all the information shared in this price prediction, are published in good faith. Readers must do their research and due diligence. Any action taken by the reader is strictly at their own risk. Coin Edition and its affiliates will not be held liable for any direct or indirect damage or loss.
Disclaimer: The information presented in this article is for informational and educational purposes only. The article does not constitute financial advice or advice of any kind. Coin Edition is not responsible for any losses incurred as a result of the utilization of content, products, or services mentioned. Readers are advised to exercise caution before taking any action related to the company.
 Price Prediction: Can BTW Sustain Its Breakout Above $0.1032?")


