


- LUNC’s price increased and its market cap surpassed the $1 billion market.
- Bulls continued to dictate the momentum with the Fibonacci extension, suggesting a climb to $0.000016.
- The 20 EMA flipped the 50 EMA on the daily chart, reinforcing the price increase potential.
In the last 24 hours, the price of Terra Classic (LUNC) has increased by a tremendous 29.45%, according to CoinMarketCap data. The price increase also affected its market cap which rose above the $1 billion mark.
LUNC’s price increase came amid growing bullish sentiment in the market. However, there was another catalyst that pushed LUNC’s price higher which was the Binance burn. On March 1, Binance burned 2.21 billion LUNC tokens.
The idea behind the burning is to make the token scarce while boosting the value if demand increases. Furthermore, ‘Vegas’, a prominent member of the Terra community revealed that the number of tokens burned in total has crossed 100 billion.
LUNC/USD 4-Hour Analysis
The 4-hour LUNC/USD chart showed that bullish mometum began building up around February 23. During that time, bulls camped at the $0.000011 support while pushing the price to $0.000013.
However, the breakout did not happen until March 1 when LUNC changed hands at $0.000014. At press time, the candlesticks on the 4-hour timeframe were all bullish, indicating that sellers were almost non-existent.
An assessment of the Relative Strength Index (RSI) showed that the reading was in the overbought region. Despite that, it does not seem like LUNC would retrace as the bulls continue to dictate the momentum.
According to the Fibonacci extension indicator, LUNC has a lot of upside potential. For instance, the 0.618 Fib level was around $0.000016, meaning a pullback might not be significant.
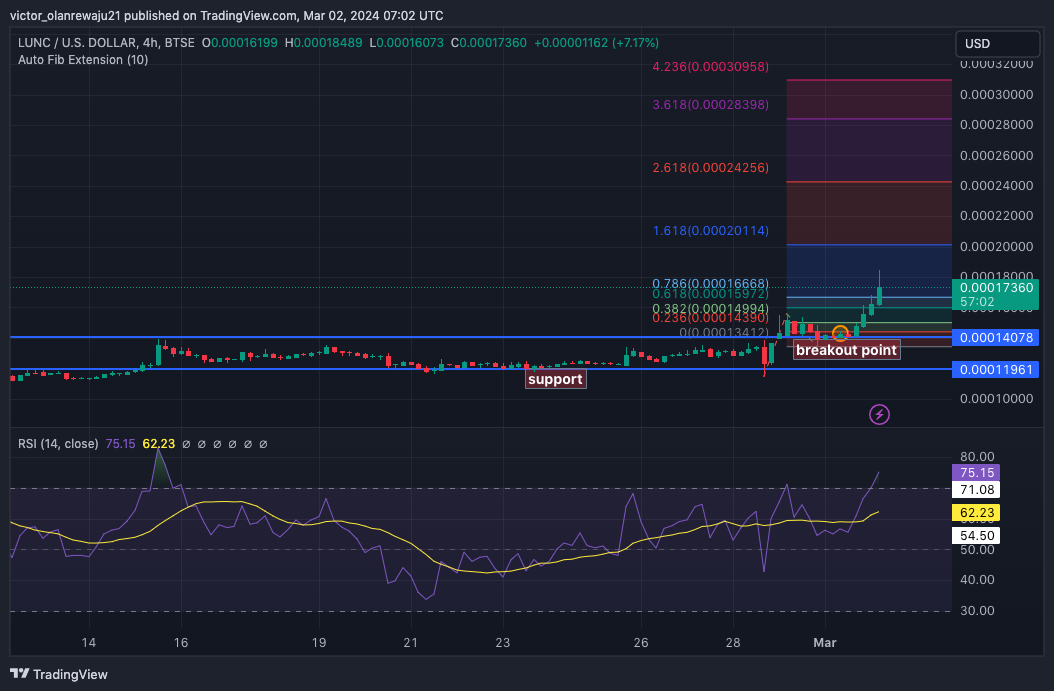
To the upside, the 3.618 Fibonacci extension was positioned at $0.000028. If buying pressure increases, LUNC’s price might rally toward $0.000030. However, a bearish appearance might slow down the uptrend if some traders decide to book profits.
LUNC/USD Daily Analysis
For a long while, LUNC experienced selling pressure as shown on the daily timeframe. However, sellers got exhausted around the first few days of February. This fatigue laid the grounds for the pump the token was currently experiencing.
In addition, Coin Edition examined the Exponential Moving Average (EMA). As of this writing, the 20 EMA (blue) had crossed over the 50 EMA (yellow), indicating a bullish trend. In the short term, a dearth cross where the 50 EMA flips the 20 EMA could cause LUNC to pull back.
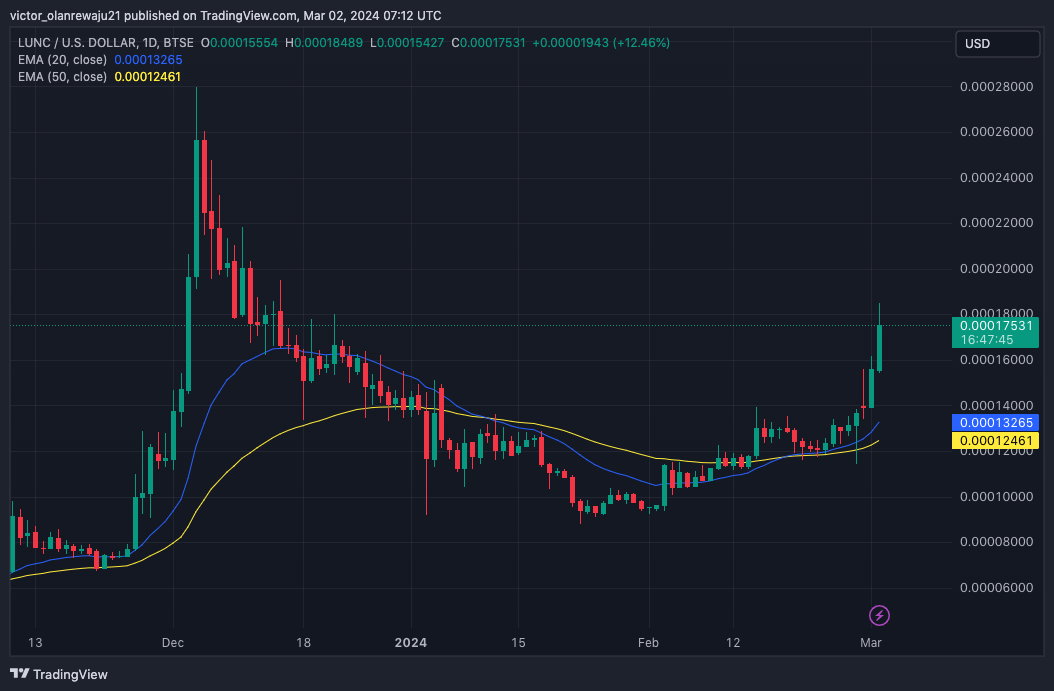
If this happens, the price could slide toward $0.000012. However, if LUNC closes above both EMAs and the golden cross remains the same, the price might continue to climb.
Disclaimer: The information presented in this article is for informational and educational purposes only. The article does not constitute financial advice or advice of any kind. Coin Edition is not responsible for any losses incurred as a result of the utilization of content, products, or services mentioned. Readers are advised to exercise caution before taking any action related to the company.
 Price Prediction 2026, 2027, 2028, 2029, 2030 -2050")


