


 Rebounds After Hitting $4.56 Support")
- As the bears’ hold on the DOT market weakens, bulls are able to seize the momentum.
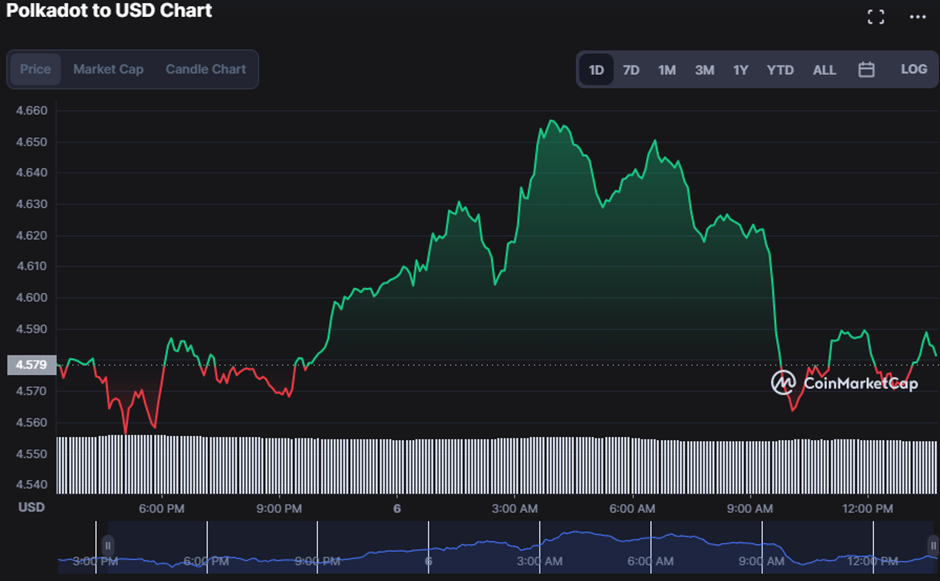
- Bulls have pushed the price up to $4.60, a 0.45% increase, as of press time.
- Technical indicators warn traders to tread cautiously in the short term.
After bears pushed Polkadot (DOT) to a low of $4.56 throughout the trading day, bulls regained control of the market. As the price of Polkadot has dropped significantly, bulls may decide to increase their holdings. This bullish control successfully drove DOT price to $4.60 a 0.45% rise.
In the upswing, bulls were able to boost market value by 0.45% to $5,305,519,275. However, the 24-hour trading volume dropped by 4.08% to $113,647,258 suggesting that it is time to sell and take gains.
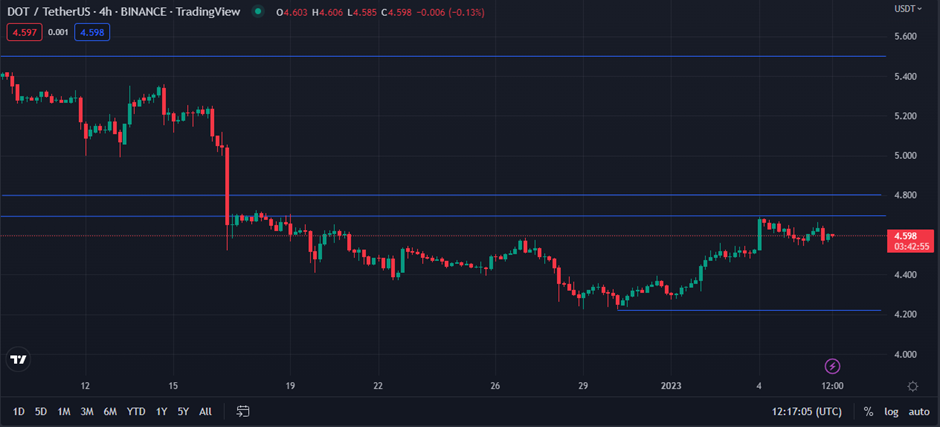
The DOT price has been driven up by bulls to an intraday high of $4.80. The bulls have a chance to reclaim the $5 level in DOT if they can hold the present price and the momentum. Breakout from the present range is likely if bulls can sustain the price between $4.80 and $5.
If DOT is going to continue to increase, the $5 level of resistance must be broken.The bulls may look to the $5.50 resistance level, a key psychological milestone for DOT traders, as their next goal. If the bulls are successful in breaking the $5.50 resistance level, then there is a good likelihood of a continued upward trend. However, if the bears win and the DOT price falls below the $4.80 support level, it will be a sign of weakness and may foreshadow more decline in the price.
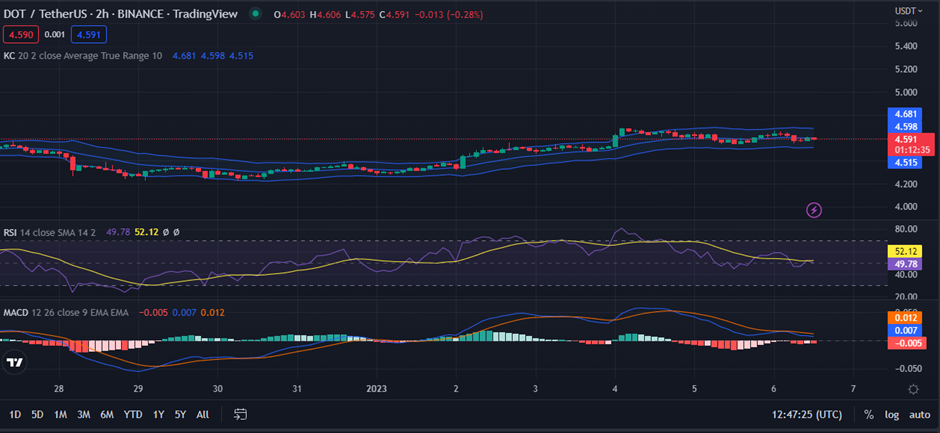
With the upper band at $4.679 and the lower band at $4.516, the Keltner channel bands on the DOT price chart are moving linearly, indicating that the market is steady . With the asset trading in the middle of these zones, it is neither overbought nor oversold. Investors may see price variations as prices move within these ranges, but they should avoid getting caught up in any wild swings. Therefore, investors are advised to keep their holdings open for the long haul in the hopes of achieving profits.
The latest crossing of the RSI below its SMA level of 48.86 is causing concern among traders. If the RSI drops below 50, it indicates that the market is losing momentum and that a downward trend may be on the horizon. Traders should exercise prudence and avoid taking unnecessary risk in the current climate.
The recent drop of the MACD below the signal line at 0.007 and the present downward trend of the histogram both contribute to the dismal forecast. The market may see a reversal since the MACD had a negative crossover. Traders may want to play it cautious by unloading long positions and putting off new long deals until the situation improves.
Despite several indicators pointing to another negative run, the DOT market may have a good run if the bulls can maintain the resistance level.
Disclaimer: The views and opinions, as well as all the information shared in this price analysis, are published in good faith. Readers must do their own research and due diligence. Any action taken by the reader is strictly at their own risk, Coin Edition and its affiliates will not be held liable for any direct or indirect damage or loss.
Disclaimer: The information presented in this article is for informational and educational purposes only. The article does not constitute financial advice or advice of any kind. Coin Edition is not responsible for any losses incurred as a result of the utilization of content, products, or services mentioned. Readers are advised to exercise caution before taking any action related to the company.


