


- MATIC price faces bearish momentum, possible market bottom formation.
- CMF indicates buying pressure despite bearish sentiment.
- UO and RSI suggest a potential trend reversal and a bullish market ahead.
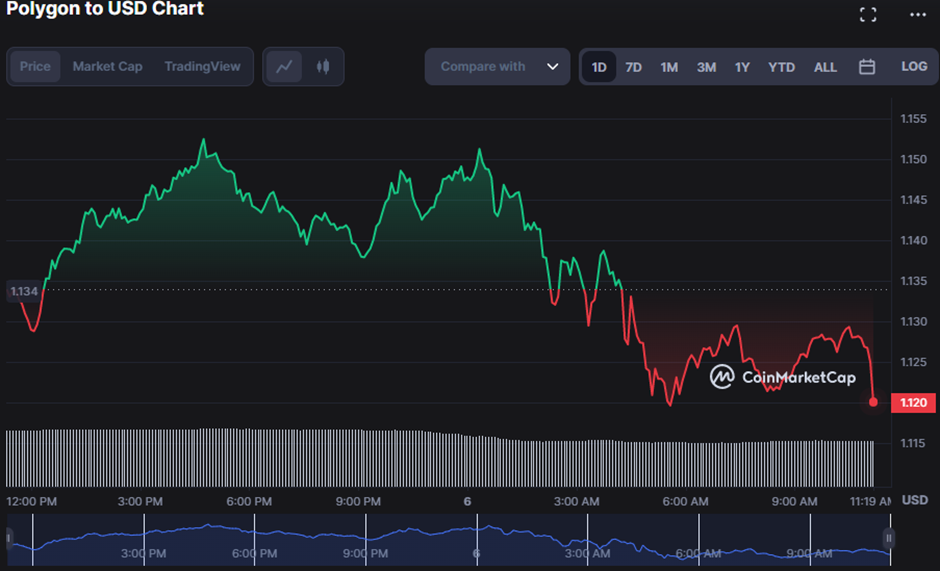
While the Polygon (MATIC) market opened with a bearish sentiment, the bulls quickly regained control and pushed prices to an intraday high of $1.15 before retreating. As bulls failed to break through the barrier level, MATIC’s price plummeted to an intraday low of $1.12 due to bear recapture.
The negative trend in MATIC was still apparent as of press time, with the price falling by 0.73% to $1.13. This drop made traders anxious about whether the price would fall further, causing market capitalization and 24-hour trading volume to fall by 0.74% and 18.78%, respectively, to $9,841,370,084 and $305,111,341.
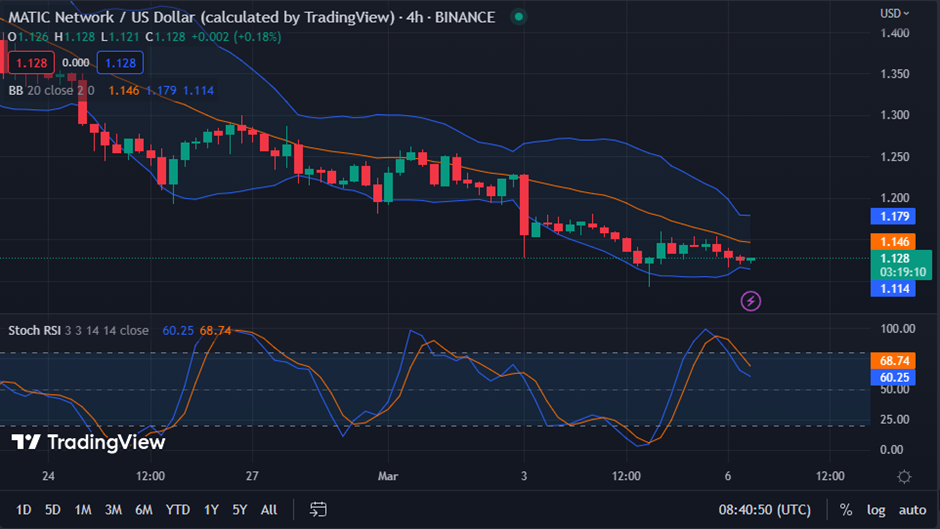
to move south. As a result of this shift, investors may want to think about shorting the MATIC token now before the trend strengthens.
If the price of MATIC continues to trend downwards, as shown by the formation of a red candlestick as it approaches the lower band, this may indicate a potential market bottom. A negative signal, and more selling pressure, might be signaled if price movement drops below the lower range.
At a value of 55.35, the stochastic RSI has formed a bearish crossing by falling below its signal line, indicating a reversal in upward momentum. This decline lends credence to the gloomy view and increases the likelihood of further price reduction.
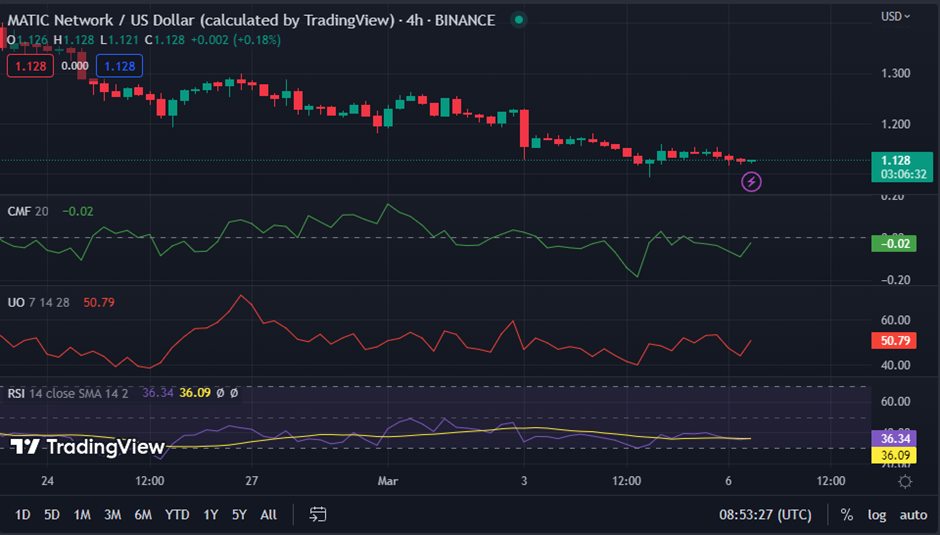
The Chaikin Money Flow (CMF) is going north, albeit in the negative range, with a value of -0.02, indicating that although the MATIC market is bearish, purchasing pressure remains.
This level might be a favorable entry opportunity for investors hoping to capitalize on the possible reversal. This movement shows that money returns to the market and that investor mood shifts.
When the Ultimate Oscillator reads 50.79 and points north, it signals a likely trend reversal and a bullish market. This assumption comes because the UO at this level shows that the momentum is transitioning from oversold to bullish territory and that buying pressure may strengthen in the short future.
With a Relative Strength Index (RSI) of 36.34 and above its signal line, MATIC markets may witness a price gain due to the momentum change. The transition from oversold to bullish territory is a bullish omen for MATIC investors, suggesting that purchasing pressure is expected to strengthen shortly, signaling potential price gain.
MATIC faces bearish momentum, but signs of buying pressure and potential trend reversal offer hope for investors.
Disclaimer: The views, opinions, and information shared in this price prediction are published in good faith. Readers must do their research and due diligence. Any action taken by the reader is strictly at their own risk. Coin Edition and its affiliates will not be liable for direct or indirect damage or loss.
Disclaimer: The information presented in this article is for informational and educational purposes only. The article does not constitute financial advice or advice of any kind. Coin Edition is not responsible for any losses incurred as a result of the utilization of content, products, or services mentioned. Readers are advised to exercise caution before taking any action related to the company.
: What Happens If You Use an Unlicensed Platform?")


