


- MATIC flipped LINK’s market price as its price gained over 8% within 24 hours.
- The token’s strong correlation with ETH also impacted the price increase.
- A break above $0.91 could lead MATIC to another 10% increase.
The price of Polygon (MATIC) surged by 8.10% in the last 24 hours, as many altcoins rallied to new yearly highs. At press time, MATIC’s price was $0.90, according to data from CoinMarketCap.
But before reversing to the said value, MATIC’s price hit $0.93 on January 11. As a result of the increase, the Polygon market cap flipped Chainlink (LINK) to become the 13th most valuable project in the market at the time of press.
However, LINK’s price also increased within the same timeframe, however, MATIC’s run was harder. At the time of writing, Chainlink’s market cap was $8.37 billion while Polygon’s market cap was $8.55 billion.
MATIC Shines, Follows ETH
The rise of MATIC could be linked to several factors. But the most important of them was the rising interest in the Polygon Proof-of-Stake (PoS) ecosystem.
For instance, on January 9, crypto analyst Lark Davis disclosed that active addresses on the Polygon network surpassed that of Solana (SOL).
This was also reiterated by the project’s co-founder Sandeep Nailwal. As per Nailwal, the surge in active addresses helped Polygon rise higher than Ethereum (ETH) in terms of volume.
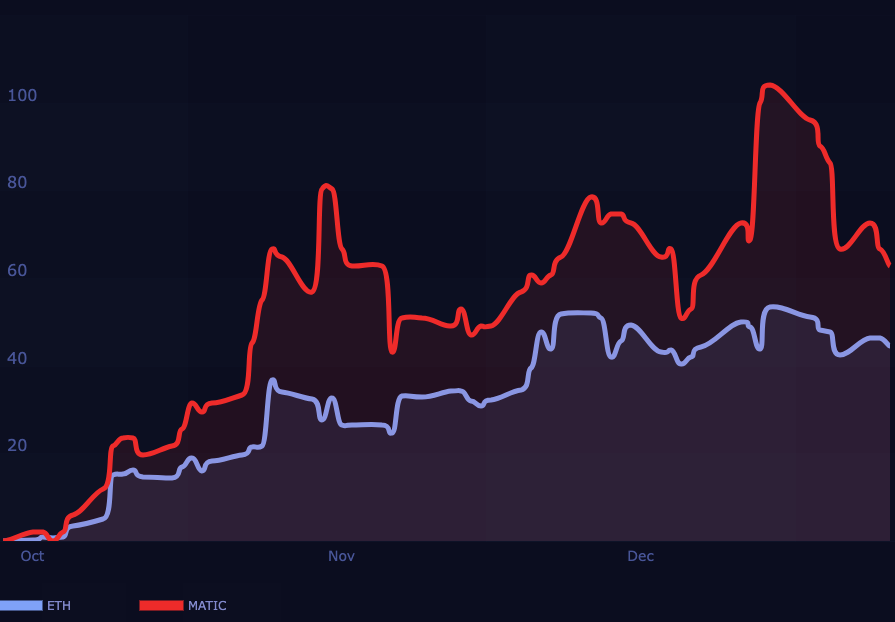
However, MATIC’s strong correlation with ETH also played a part in the recent price increase. Coin Edition considered Macroaxis data and observed that the correlation coefficient between both cryptocurrencies was 0.89.
On a 90-day timeframe, ETH would have given buyers 0.61 times what MATIC holders would have gotten. But in terms of direction, both assets moved together several times.
What’s Next After the Rebound?
MATIC’s bounce, as shown by the 4-hour chart, was a notable one. This was because previous attempts at an upward breakout had been met with rejection. First, the resistance at $0.84 pushed back the price on January 6. A similar scenario unfolded on January 8.
However, the price action on January 10 ensured that bulls were able to successfully break the resistance. Furthermore, there appears to be another resistance at $0.91.
A breakdown below $0.90 could possibly lead MATIC back to $0.81 which was its closest support. On the other hand, a strong bounce above $0.91 could foster a 10% rise which could rise $0.99 or eventually hit $1.
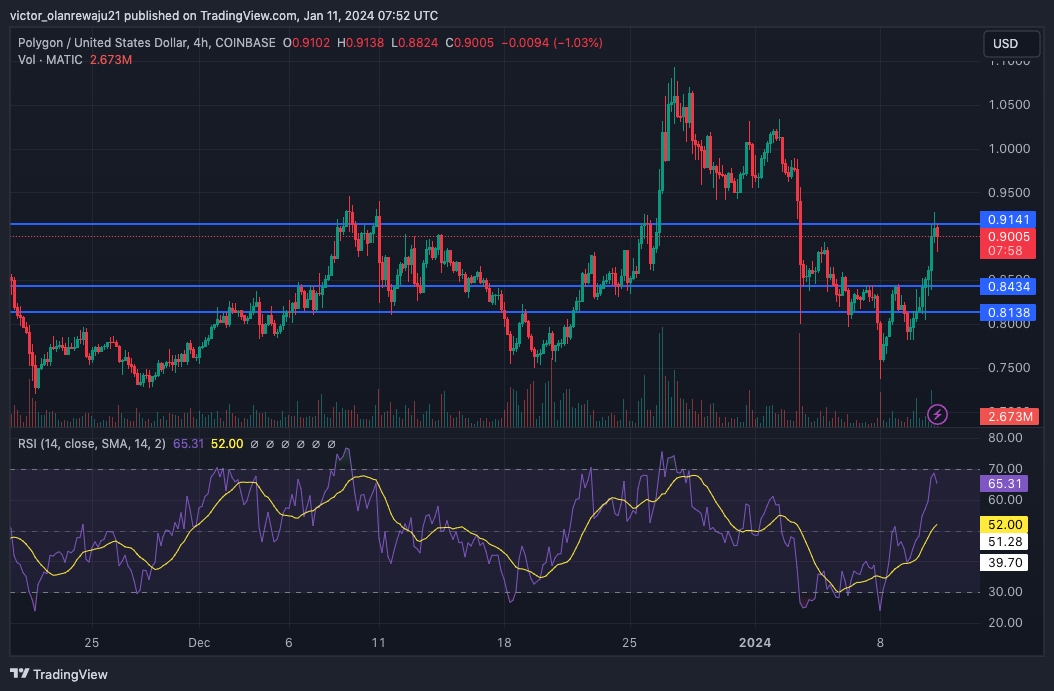
Per the Relative Strength Index (RSI), MATIC was not yet overbought since the reading was 65.31. This means the buying momentum was strong. This could suggest that the MATIC price still has room to increase indicating a high potential for the cryptocurrency to hit another yearly high.
Disclaimer: The information presented in this article is for informational and educational purposes only. The article does not constitute financial advice or advice of any kind. Coin Edition is not responsible for any losses incurred as a result of the utilization of content, products, or services mentioned. Readers are advised to exercise caution before taking any action related to the company.


