


- DOGE’s support at $0.075 could prevent it from another nosedive.
- SHIB may head northward while FLOKI’s overbought signals suggest a reversal.
- MEME may be at risk of dropping below $0.025; PEPE traders may find good entries around $0.000001.
Led by Dogecoin (DOGE), the memecoin market has not had a good show since the start of November. For instance, DOGE’s value in the last 30 days has decreased by 3.70%, according to data from CoinMarketCap.
Others like Memecoin (MEME), Floki (FLOKI), Shiba Inu (SHIB), and Pepe(PEPE) have also seen their prices slip within the same period. At press time, SHIB’s price was $0.000008, indicating a 7-day 4% decrease.
PEPE exchanged hands at $0.0000010, representing a 5.14% plunge. The prices of MEME and FLOKI were not any better, losing 1.23% and 17.32% of their respective values within the same period.
The recent performance of these memecoins contrasts with October, when most enjoyed substantial increases. However, the nosedive experienced lately may not necessarily be a signal to fret, based on technical signals.
Dogecoin (DOGE)
Since November 20, selling pressure has prevented DOGE from reaching $0.08. While there have been attempts to retest this price, rejection kept DOGE’s at $0.077 at press time.
Should selling pressure continue, DOGE is at risk of a further fall. However, there was support at $0.075 that could prevent a collapse. Should buyers defend this support, then DOGE has a chance at recovery.
One indicator to consider when predicting Dogecoin’s next movement is the Relative Strength Index (RSI). At press time, the RSI was 47.32, suggesting bearish movement. But dropping below the midpoint of the indicator can also prove vital for a DOGE uptick.
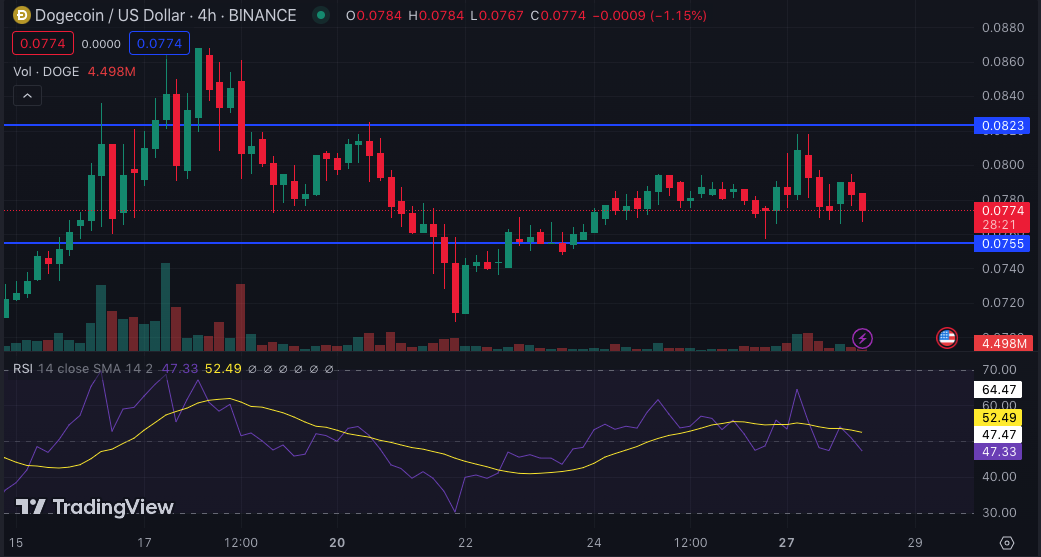
If bulls decide to ramp up buy orders around $0.075, then DOGE may not only retest $0.08. But it could also drive at $0.09 in the short term.
Shiba Inu (SHIB)
In terms of its network activity, Shiba Inu has been showing positive signs. For example, there was a time when the token burn rate spiked to impressive levels. Activity on the Shibarium L2 has also been relatively high.
However, landmarks in those aspects have not translated to good performance of the SHIB token. From the 4-hour SHIB/USD chart, there has been a crossover of the 20 EMA (yellow) over the 9 EMA (blue).
As a short straddle strategy, the EMA helps traders position themselves for potential buy or sell calls. In the case of SHIB, the 9 above 20 EMA trend is a sign that the direction is bearish. So, traders may want to open short positions at $0.0000080.
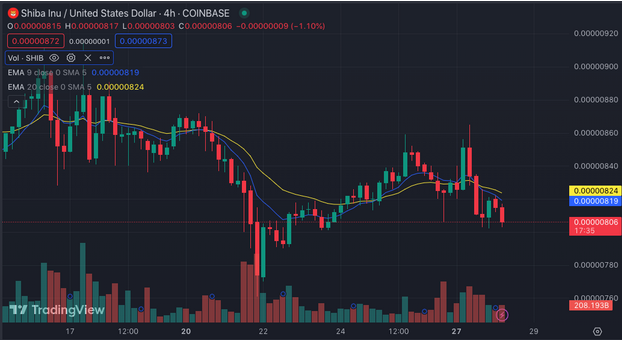
However, bears should be wary of a SHIB mid-term decline. Should interest in memecoins reappear, shorts may be liquidated and SHIB could push towards $0.00001.
Floki (FLOKI)
Following a dreadful recent performance, FLOKI’s price at press time was $0.000031. However, the 4-hour FLOKI/USD chart showed that sellers may soon be exhausted.
This assertion was supported by the Bollinger Bands (BB). The bands had expanded at the time of writing, indicating potential volatility. Notably, the lower band touched FLOKI at $0.000030.
This suggests that the token was overbought. So, FLOKI may be due for a bounce soon. But for the uptrend to be confirmed, the Moving Average Convergence Divergence (MACD) has to flip positive.
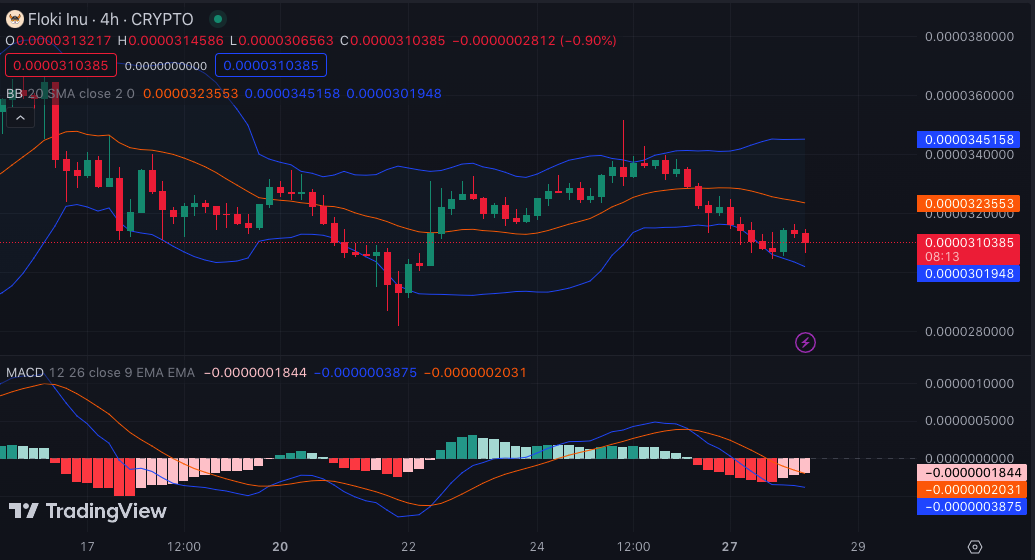
For that to happen, the 12-day EMA (blue) has to rise above the 26-day EMA (orange). Once that happens, FLOKI’s next target could be $0.000035.
Pepe (PEPE)
Recently, PEPE climbed back into the top 100 cryptocurrencies by market capitalization. But despite its ranking, the price has not been able to reverse its week-long decline.
The trading volume of PEPE has also been decreasing. When put side by side with the price, the decreasing volume is a sign of weakness in the price direction. So, if sellers eventually become fatigued, demand by buyers may drive the price upwards.
If demand increases and the price rises, traders can still find entries around $0.000001, as indicated by the 0.382, 0.5, and 0.618 Fibonacci retracement levels.
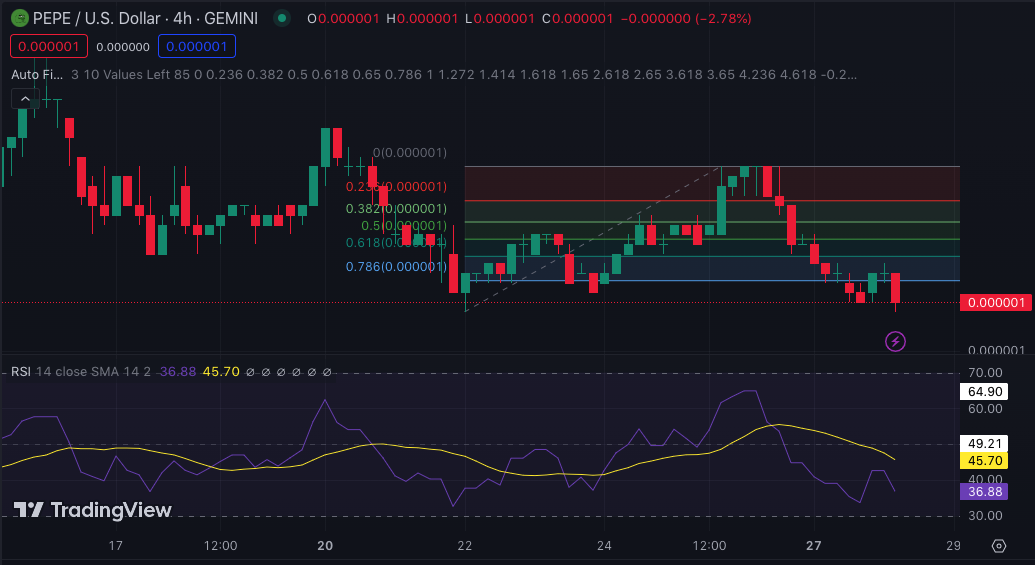
Also, the RSI indicated that PEPE was approaching oversold levels. Therefore, buying pressure at any point in time may be enough to push up PEPE’s price.
Memecoin (MEME)
Turning to MEME, a cryptocurrency backed by Binance Labs. After MEME went live for trading in October, spot buyers were able to make some early gains. MEME reached its all time high of $0.039 on November 15. However, indications from the 1-hour chart showed that sellers appear to have taken control.
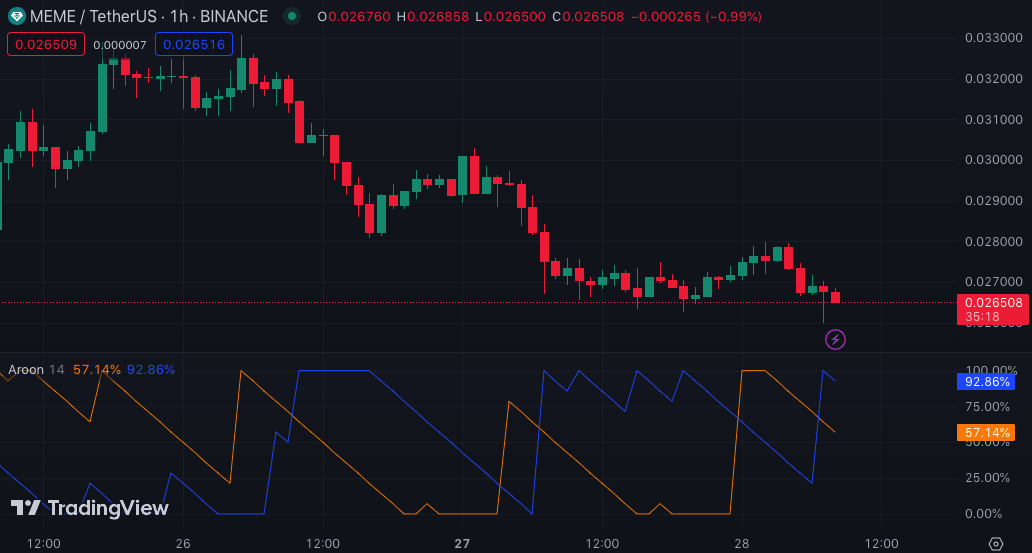
The drop also means that MEME might continue to slide. This is because the Aroon Up (orange) was lower than the Aroon Down (blue), confirming that sellers were still in control. Should the sell pressure continue, MEME may fall below $0.025.
Disclaimer: The information presented in this article is for informational and educational purposes only. The article does not constitute financial advice or advice of any kind. Coin Edition is not responsible for any losses incurred as a result of the utilization of content, products, or services mentioned. Readers are advised to exercise caution before taking any action related to the company.
: What Happens If You Use an Unlicensed Platform?")


