


 Price Prediction 2024-2030: Will TRAC Price Hit $2 Soon?")
OriginTrail (TRAC) has caught the attention of investors and traders alike, with its unique focus on supply chain tracking and its recent bullish momentum. With increasing interest in blockchain solutions for real-world applications, TRAC is well-positioned for long-term growth. This article dives into the future price potential for TRAC from 2024 to 2030, analyzing current trends, market sentiment, and the factors that could influence its trajectory.
Table of contents
- What is OriginTrail (TRAC)?
- OriginTrail (TRAC) Market Status
- OriginTrail (TRAC) Price Prediction 2024-2030 Overview
- OriginTrail (TRAC) Price Prediction: Moving Averages
- OriginTrail (TRAC) Price Prediction: Ichimoku Cloud
- OriginTrail (TRAC) Price Prediction 2024
- OriginTrail (TRAC) Price Prediction 2025
- OriginTrail (TRAC) Price Prediction 2026
- OriginTrail (TRAC) Price Prediction 2027
- OriginTrail (TRAC) Price Prediction 2028
- OriginTrail (TRAC) Price Prediction 2029
- OriginTrail (TRAC) Price Prediction 2030
- FAQs
What is OriginTrail (TRAC)?
OriginTrail is a blockchain-based protocol that specializes in tracking supply chain data. Its mission is to make supply chains more transparent, efficient, and secure by leveraging decentralized networks. Through partnerships and innovative technology, OriginTrail is transforming how industries manage and verify data across global supply chains.
OriginTrail (TRAC) Market Status
OriginTrail (TRAC) is currently trading at $0.646, experiencing a 5.93% increase over the past 24 hours. With a market cap of $268.06 million, it ranks within the top 200 cryptocurrencies by market capitalization. The trading volume has surged by 29.63% in the last 24 hours, indicating growing interest in the asset.
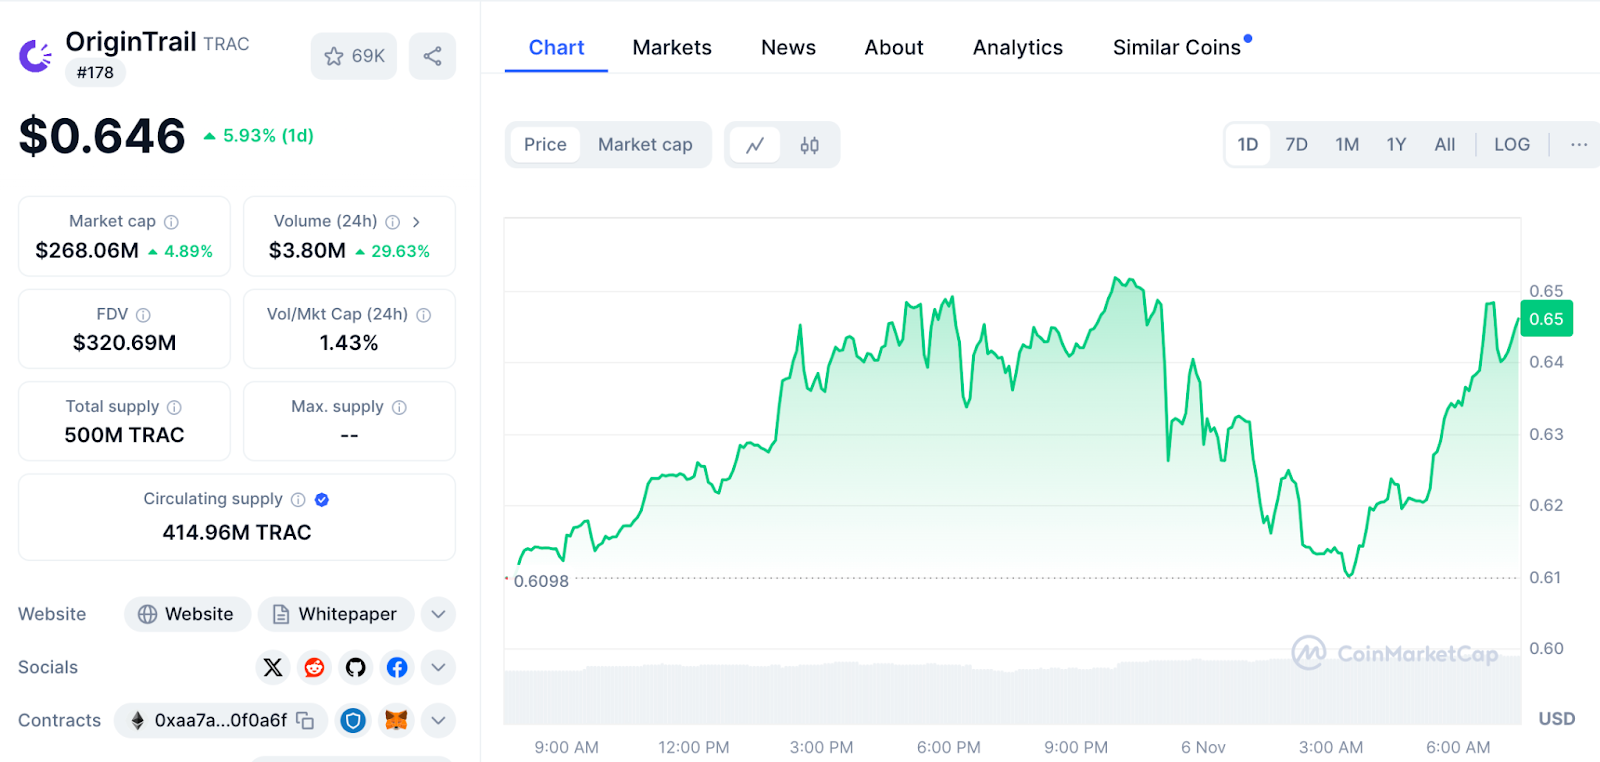
OriginTrail has shown strong resilience in the face of market volatility, and its recent performance reflects a bullish sentiment. TRAC’s price has climbed from a low of $0.61 to a high of $0.65, supported by solid trading volume. This performance is consistent with the growing adoption of blockchain in supply chain management, further boosting confidence in TRAC’s potential.
OriginTrail (TRAC) Price Prediction 2024-2030 Overview
| Year | Potential Low ($) | Potential High ($) |
| 2024 | 0.75 | 1.00 |
| 2025 | 1.20 | 1.50 |
| 2026 | 1.80 | 2.25 |
| 2027 | 2.50 | 3.00 |
| 2028 | 3.50 | 4.00 |
| 2029 | 4.50 | 5.50 |
| 2030 | 6.00 | 7.50 |
OriginTrail (TRAC) Price Prediction: Moving Averages
Looking at an in-depth analysis, we see that the price is currently trading above the 50-period SMA at approximately 0.5740, indicating short-term bullish momentum. The 100-period SMA at around 0.5282 is also below the current price, suggesting support and confirming the upward trend. The 200-period SMA at around 0.5063 is the lowest of the three, with the price staying well above it, reinforcing the overall bullish sentiment.
The alignment of these SMAs, with the 50 SMA on top, followed by the 100 SMA, and the 200 SMA at the bottom, suggests a strong uptrend, commonly known as a “bullish alignment.” The price has recently made a higher high around the 0.6465 level after a series of upward moves, showing strong buying interest. The bullish candlesticks with minimal retracement indicate sustained buying pressure. The recent candle wicks above the closing price may suggest some profit-taking or selling pressure at higher levels, but the trend remains upward as long as the price stays above the 50 SMA.
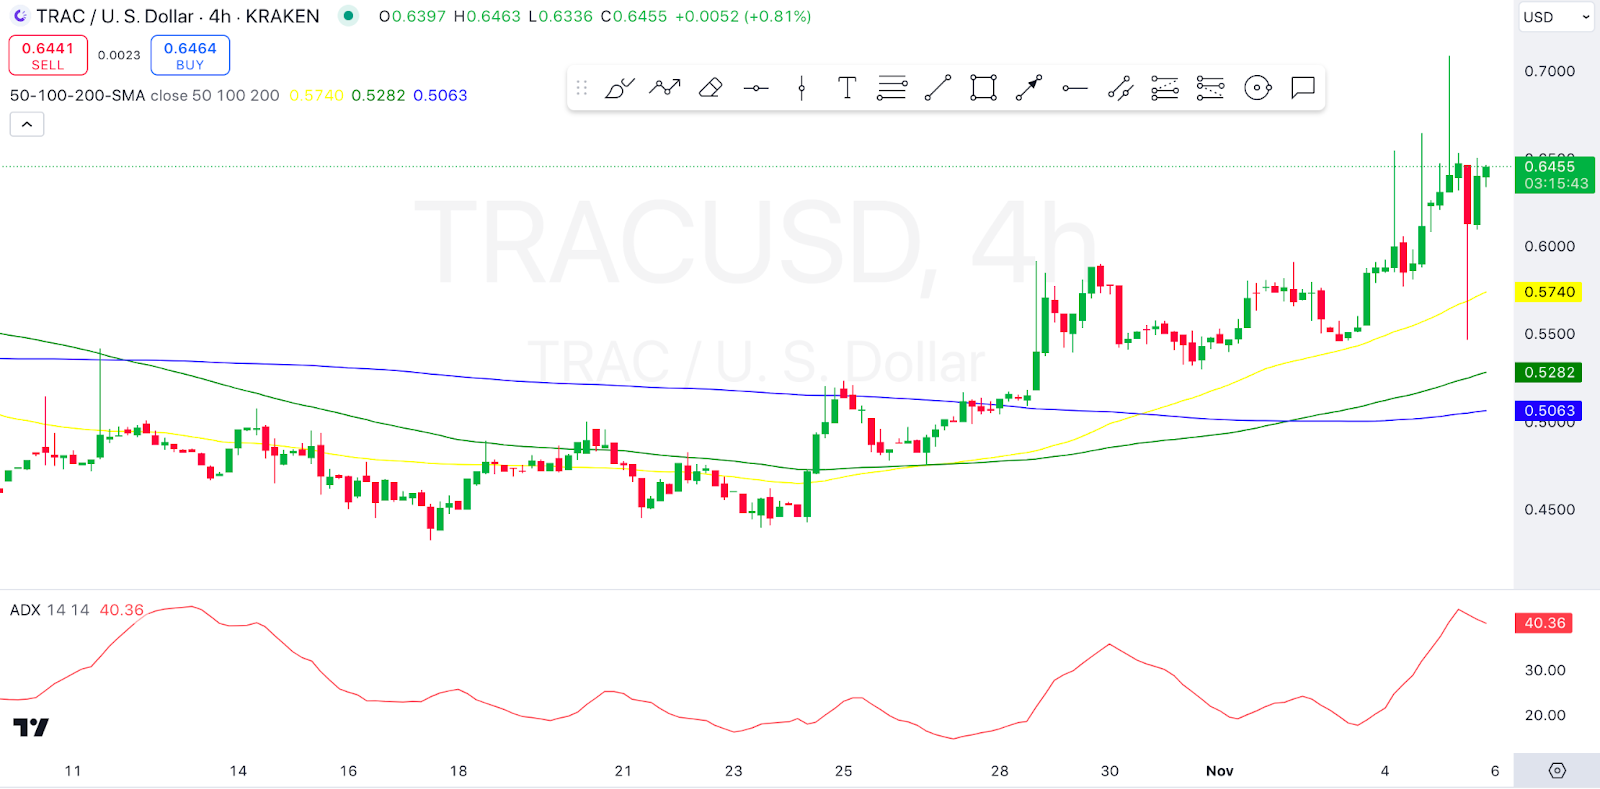
On the other hand, we see that the ADX (Average Directional Index) is at 40.36, which is a relatively high level, indicating a strong trend. Values above 25 generally signify a strong trend, so the reading at 40 suggests this upward momentum is well-established. The trend remains bullish as long as the price holds above the 50 SMA. A close above the recent high around 0.6465 could indicate a continuation of the uptrend. If the price fails to hold above the 50 SMA and starts moving below the 100 SMA, it could signal weakening momentum and potentially a trend reversal.
OriginTrail (TRAC) Price Prediction: Ichimoku Cloud
Further analysis reveals that the Ichimoku Cloud (Kumo) appears green, which suggests a bullish trend in the medium term. The price is trading above the cloud, indicating a strong bullish sentiment. The blue line (Tenkan-sen or Conversion Line) is above the red line (Kijun-sen or Base Line), which further supports a bullish outlook. Additionally, both lines are above the cloud, strengthening the uptrend signal. The green line (Chikou Span) is above the price action and the cloud, confirming the bullish momentum. When the Lagging Span is above the current price, it suggests that past prices were lower, which aligns with bullish market sentiment.
The price action displays a series of higher highs and higher lows, indicative of an upward trend. The recent candles show some consolidation near the $0.6455 level, which may act as a resistance point. If the price breaks above the recent high around $0.6465, it may signal a continuation of the bullish trend. However, a failure to break this level could lead to a pullback.
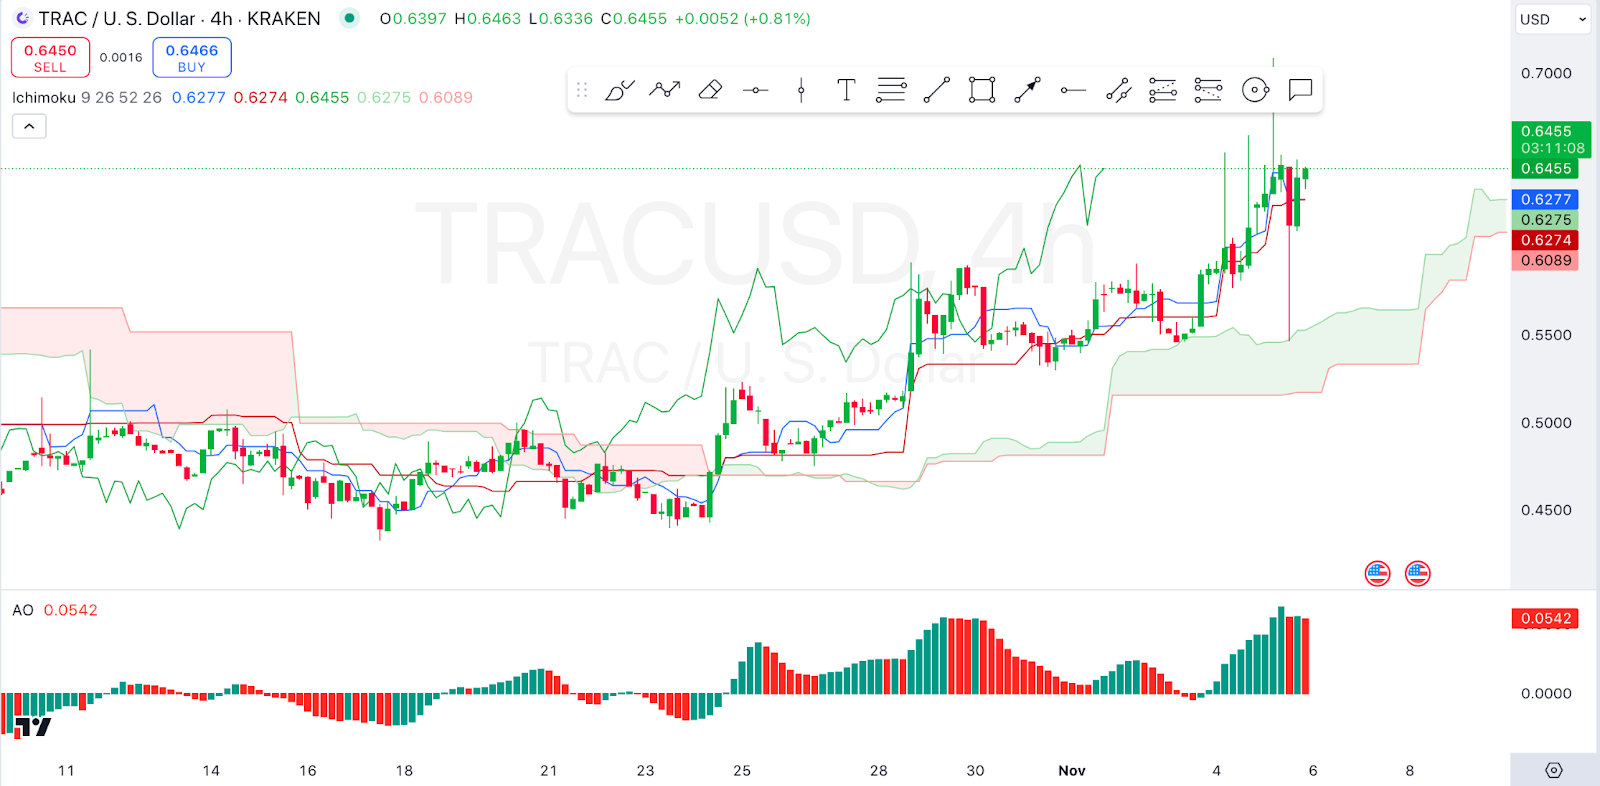
On the other hand, we see that the Awesome Oscillator (AO)* is positive (green bars), suggesting upward momentum. The presence of larger green bars indicates increasing bullish momentum, though recent red bars signal some potential slowing or consolidation. A shift back to green bars could confirm a resumption of the upward trend.
OriginTrail (TRAC) Price Prediction 2024
In 2024, TRAC’s price could benefit from further blockchain adoption within supply chain management. If OriginTrail expands its partnerships and technological advancements, the price may rise to between $0.75 and $1.00. This range reflects moderate growth fueled by market adoption and industry interest in transparency and security.
OriginTrail (TRAC) Price Prediction 2025
By 2025, OriginTrail may see increased demand as it continues to innovate and integrate within larger networks. Price predictions suggest TRAC could reach between **$1.20 and $1.50**. This growth assumes a favorable market sentiment toward utility-driven projects and rising adoption of decentralized supply chain tracking solutions.
OriginTrail (TRAC) Price Prediction 2026
As blockchain matures, TRAC might reach a new level of utility and value in 2026. Analysts predict a price range of $1.80 to $2.25. With enhanced network functionality and potential regulatory support for blockchain in supply chain applications, TRAC could achieve strong market momentum.
OriginTrail (TRAC) Price Prediction 2027
In 2027, TRAC’s growth may accelerate, with forecasts suggesting a price between $2.50 and $3.00. By this time, OriginTrail might secure additional large-scale partnerships, enhancing the network’s usage and overall market valuation.
OriginTrail (TRAC) Price Prediction 2028
The year 2028 could see continued upward momentum, as the price might fluctuate between $3.50 and $4.00. This period could represent TRAC’s consolidation phase, with broad adoption in industries such as logistics, retail, and manufacturing.
OriginTrail (TRAC) Price Prediction 2029
By 2029, OriginTrail’s established position in the market may drive its price to $4.50 to $5.50. Growing regulatory clarity and mainstream adoption of blockchain technology would likely reinforce TRAC’s value, leading to stronger market confidence.
OriginTrail (TRAC) Price Prediction 2030
In 2030, TRAC could potentially reach its peak at between $6.00 and $7.50. This projection is based on the assumption that OriginTrail will maintain a leading role in decentralized data management and secure supply chains. Its impact on global supply networks could translate into substantial long-term gains.
FAQs
OriginTrail is a blockchain platform designed to enhance transparency, efficiency, and security in supply chain management by enabling decentralized data exchange.
As of now, TRAC is trading at $0.646 with a market cap of $268.06 million, ranking #178 on CoinMarketCap.
Key factors include technological advancements, industry partnerships, market adoption of blockchain in supply chains, and potential regulatory support.
The long-term value of TRAC could be driven by broader blockchain adoption, OriginTrail’s strategic partnerships, technological upgrades, and supportive regulatory policies.
Disclaimer: The information presented in this article is for informational and educational purposes only. The article does not constitute financial advice or advice of any kind. Coin Edition is not responsible for any losses incurred as a result of the utilization of content, products, or services mentioned. Readers are advised to exercise caution before taking any action related to the company.


