


- PEPE market consolidates amid slowing trading activity.
- Sellers gain control as MFI and RSI indicate pessimism.
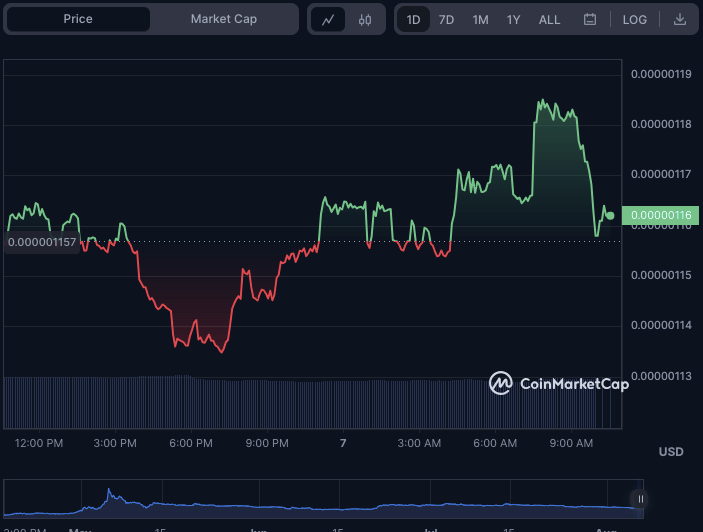
- During the bull-bear tug, PEPE found support and resistance at $0.000001135 and $0.000001186.
The bull-bear battle in the Pepe (PEPE) market has heated up in the last 24 hours, with the price bouncing off support and resistance levels of $0.000001135 and $0.000001186. PEPE was priced at $0.000001163, a slight decrease from its previous high at the time of publication.
As traders contemplate PEPE’s next possible move, this price action suggests a period of market consolidation. While PEPE’s market capitalization increased by 0.40% to $455.12 million, its 24-hour trading volume decreased by 5.39% to $58.94 million, indicating that trading activity slowed.
Alternatively, if buyers successfully push prices above $0.000001186, the next level of resistance to monitor is near $0.0000012. In contrast, if sellers drive prices below the $0.000001135 support level, the next area to watch is around the $0.000001110 area.
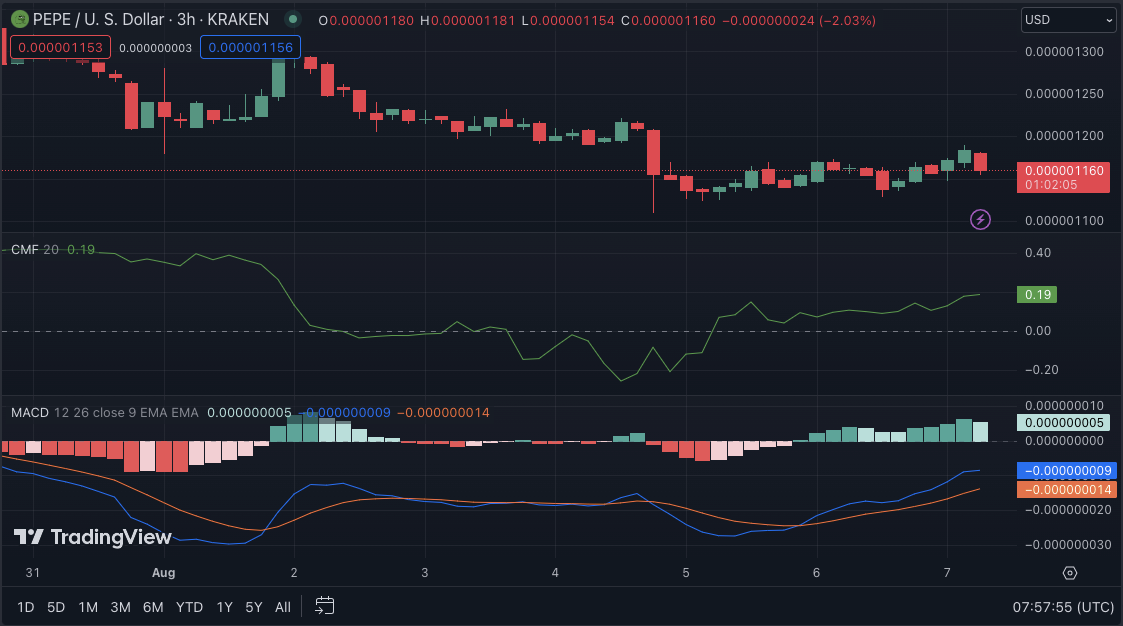
On the 3-hour price chart, the Chaikin Money Flow (CMF) points northward with a reading of 0.19, indicating some buying pressure in the market. A stronger buying trend may be signaled if the CMF keeps climbing above 0.2. However, if the CMF falls below 0.15, it may suggest a decrease in buying pressure and a potential shift toward selling activity.
The rising CMF is supported by the bullish trend indicated by the Moving Average Convergence Divergence (MACD) trajectory, which is currently -0.00000009. When the MACD line moves out of negative territory and above the zero line, it may indicate a more robust buying trend is developing.
However, a lack of momentum and possibly selling pressure in the market may be indicated if the MACD line continues to hover around or below the zero line.
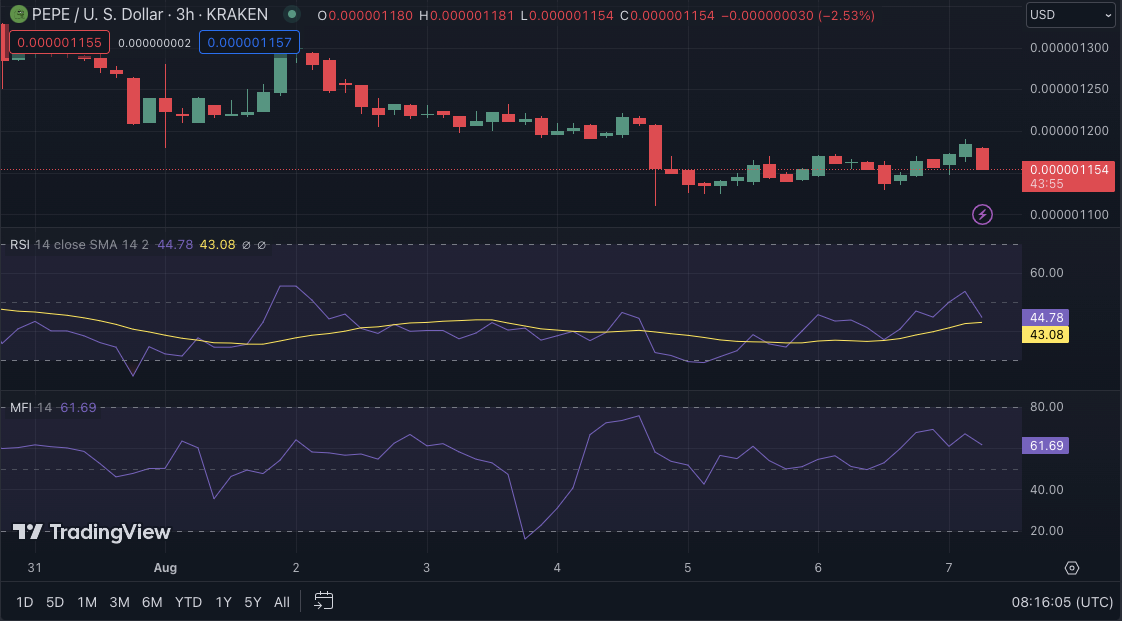
With the Relative Strength Index (RSI) pointing south at 44.78, the PEPEUSD market may face additional downward pressure. Weakening buying momentum and potential selling interest from traders are indicated by a falling RSI. If the RSI falls below 30, it may indicate an oversold condition, which could lead to a further decline in the market.
A rating of 61.69 on the Money Flow Index with a downward trend suggests that sellers may be in control of the market. When the Money Flow Index falls, it indicates that investors are becoming more pessimistic about the market as a whole. If the Money Flow Index falls below 50, it could add credence to the idea that selling pressure and falling market prices are on the horizon.
In conclusion, PEPE faces a tense battle as market consolidation continues. Buyers’ push above resistance or sellers’ pressure below support will determine its next move.
Disclaimer: The views, opinions, and information shared in this price prediction are published in good faith. Readers must do their research and due diligence. Any action taken by the reader is strictly at their own risk. Coin Edition and its affiliates will not be liable for direct or indirect damage or loss.
Disclaimer: The information presented in this article is for informational and educational purposes only. The article does not constitute financial advice or advice of any kind. Coin Edition is not responsible for any losses incurred as a result of the utilization of content, products, or services mentioned. Readers are advised to exercise caution before taking any action related to the company.
: What Happens If You Use an Unlicensed Platform?")


