


- Income Sharks predicts ATOM will rise higher in the coming days.
- ATOM has already passed the $10.4 resistance level, aiming at $13.4 as the next.
- Indicators show that a reversal may happen before another breakthrough.
A famous crypto analyst Income Sharks tweeted that ATOM is worth the risk at its current level. The popular crypto analysts analysis was based on ATOM’s alts, which are a little over extended, while other short term scalps have tight stops that look like good enough risk to reward setups.
Income Sharks anticipates that ATOM will skyrocket at the current levels that it has reached. This bullish momentum will continue further since it broke its key resistance level at $10.4. This shows that ATOM will go to the moon.
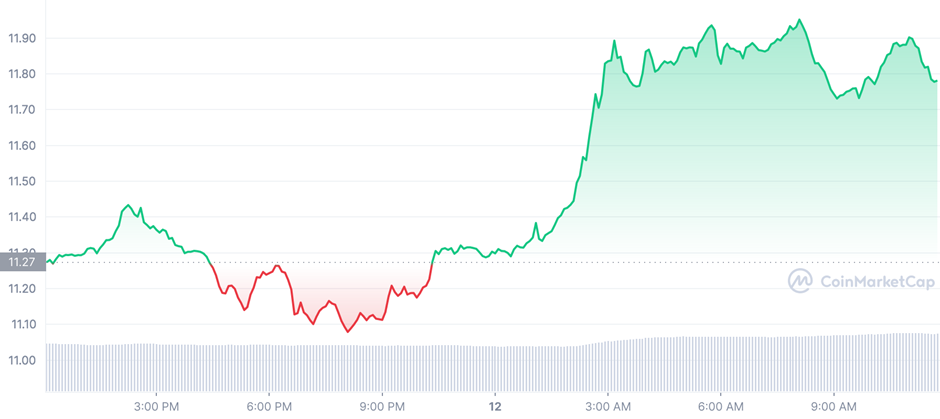
A bullish trend has dominated ATOM charts over the previous 24 hours, according to ATOM research. The coin is now valued at $11.73, a rise of 3.90% in the previous day alone. The general optimism of the crypto market, which has grown as a result of gains in previous trading sessions, is supporting this optimistic trend.
Additionally, the important resistance level being broken has acted as a catalyst, removing the bulls’ main obstacle to an upswing.
Market capitalization rose by 3.63% to $3,357,585,621 during the upswing, and 24-hour trading volume rose by 27.90% to $167,414,105. This change demonstrates that investors’ optimism about ATOM’s market potential is positive.
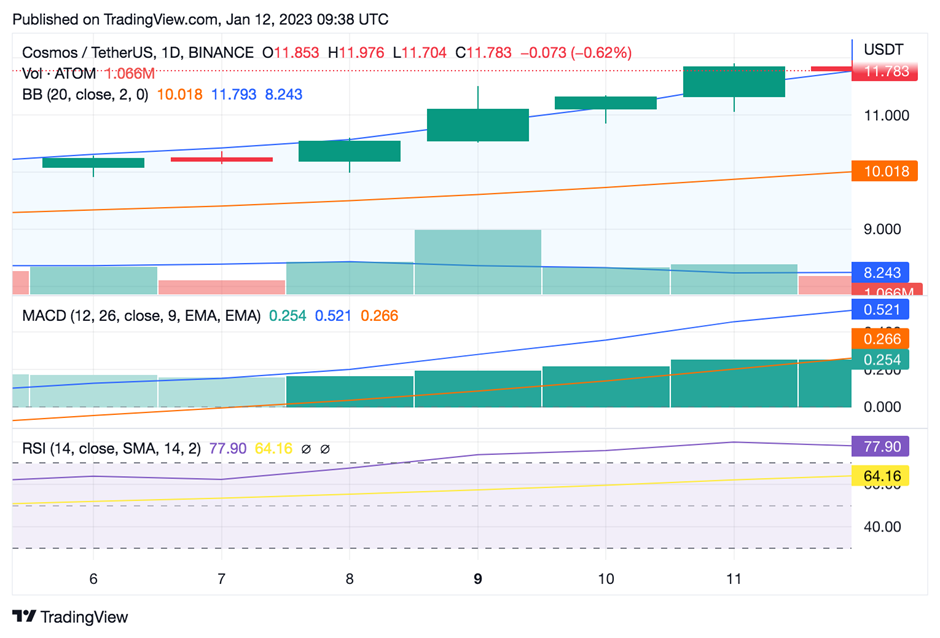
Currently, the price of ATOM has crossed the upper band, signalling a bullish trend. Furthermore, the relative strength index (RSI), which is currently at 77.90 and has advanced into the overbought region, suggests that prices may skyrocket to $13.4 resistance level after a breakthrough. Daily movement of the MACD line (blue) above the signal line suggests that the bullish momentum is intensifying (orange).
The upward trend of this MACD line and its progress toward the positive area indicate that the ATOM market will continue to be dominated by bulls. The more the histogram moves into the green area, the more likely it is that this bullish prediction will come true.
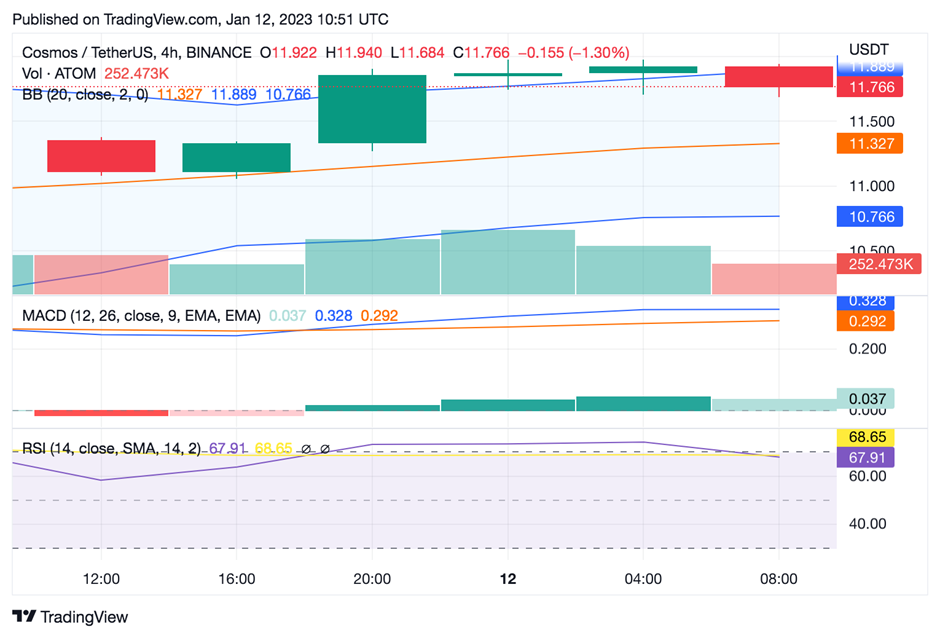
Despite the bears’ attempts at reversal, the market has built a modestly positive trend line, according to the 4-hour ATOM price analysis. In the last four hours, the prices haven’t altered all that much. In the short run, before a turn around, the bears are predicted to keep prices at a slight low of $11.766. In terms of potential price movements, the rising volatility of the ATOM/USD pair is also encouraging for buyers.
Disclaimer: The views and opinions, as well as all the information shared in this price analysis, are published in good faith. Readers must do their own research and due diligence. Any action taken by the reader is strictly at their own risk, Coin Edition and its affiliates will not be held liable for any direct or indirect damage or loss
Disclaimer: The information presented in this article is for informational and educational purposes only. The article does not constitute financial advice or advice of any kind. Coin Edition is not responsible for any losses incurred as a result of the utilization of content, products, or services mentioned. Readers are advised to exercise caution before taking any action related to the company.


