


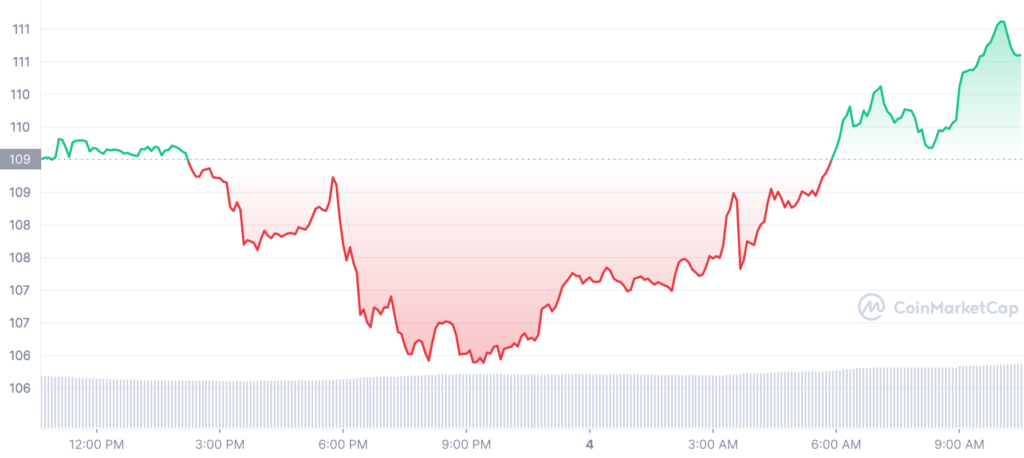
- QNT has been trading on a bullish sentiment in the past 24-hours pushing the prices to $110.
- Quant bulls struggled through to breach the $110 resistance level.
- Selling and buying pressure is currently facing the QNT market.
With the QNT/USD pair currently trading at $110.50, which represents a rise of 1.68% over the past 24 hours, this indicates a quantitative price analysis is optimistic.
As the bulls continue to dominate the market, the price of QNT skyrocketed throughout the day, rising from $106 to $110 at the time of writing.
Market volatility is reflected in market capitalisation and 24-hour trading volume. Market cap and volume have both increased. Market capitalization is up by 1.67% to $1,337,653,551 while the trading volume increased by 23.07% to $19,882,061, showing an upswing in interest in the QNT market that could result in more price increase in the near term.
The Quant is confirming a rise in coin value, according to the daily chart price analysis, and the price has been moving in a bullish direction all day. Given the ongoing increase in the QNT market price was the opposite to what was happening over the past day where QNT was trading negatively. Conditions are improving for the buyers who are currently in charge of the market.
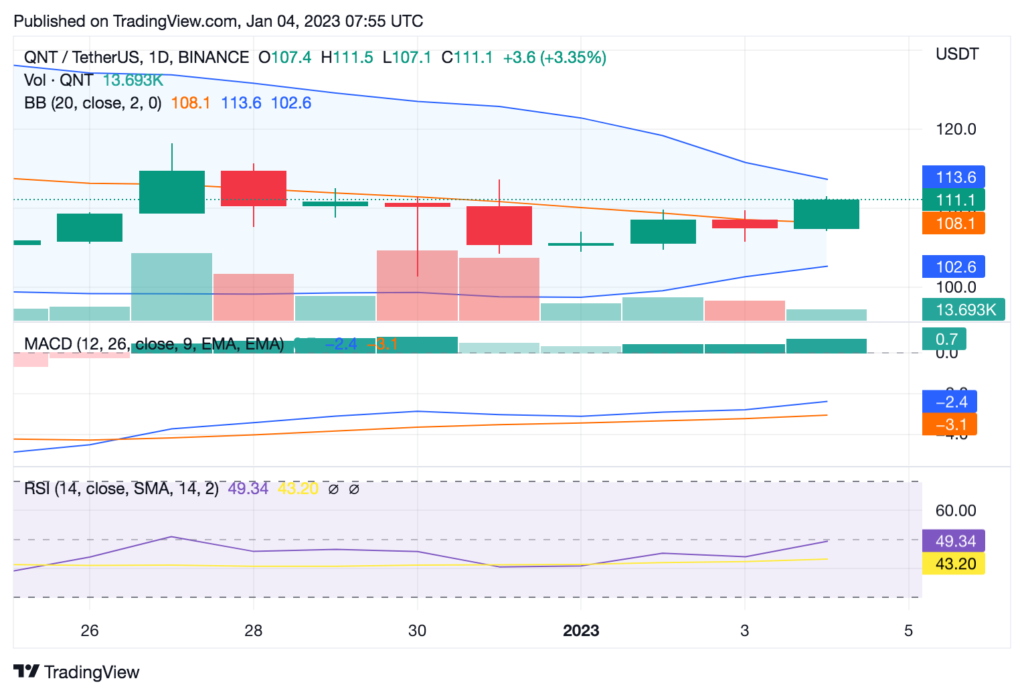
On the daily chart, the moving average convergence and divergence (MACD) indicator is still moving upward. The MACD line (blue) is crossing the signal line (red), indicating that QNT’s price will increase steadily and strongly over the next few days.
The altcoin’s present support level of $108.05 and resistance level of $114 could both act as pivot points for next price movements. The considerable upswing that has had a beneficial effect on the asset’s value over the past 24 hours,as it has made the bulls fairly successful.
The relative strength index (RSI), with a level of 49.34, is supporting this rising trend as it moves closer to the overbought region. The possibility of a price increase rises when there is movement in this direction, which is an indication of increasing purchasing pressure.
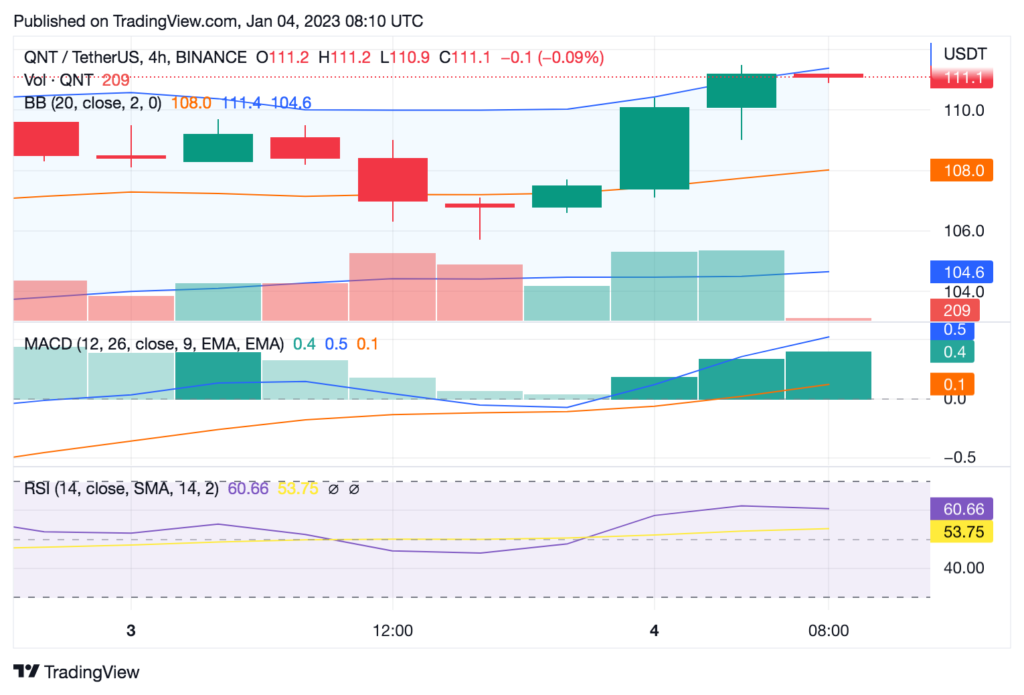
Quant has touched the upper Bollinger band on the 4-hour chart, thus the market may correct prices. Additionally, the RSI is reaching the overbought level at 60.66, which indicates the same market sentiment and further price deflation. This provides a convenient entrance for buyers.
Disclaimer: The views and opinions, as well as all the information shared in this price analysis, are published in good faith. Readers must do their own research and due diligence. Any action taken by the reader is strictly at their own risk, Coin Edition and its affiliates will not be held liable for any direct or indirect damage or loss.
Disclaimer: The information presented in this article is for informational and educational purposes only. The article does not constitute financial advice or advice of any kind. Coin Edition is not responsible for any losses incurred as a result of the utilization of content, products, or services mentioned. Readers are advised to exercise caution before taking any action related to the company.


