


- PYTH cleared the $0.90 resistance as the OBV indicated a further surge in its price.
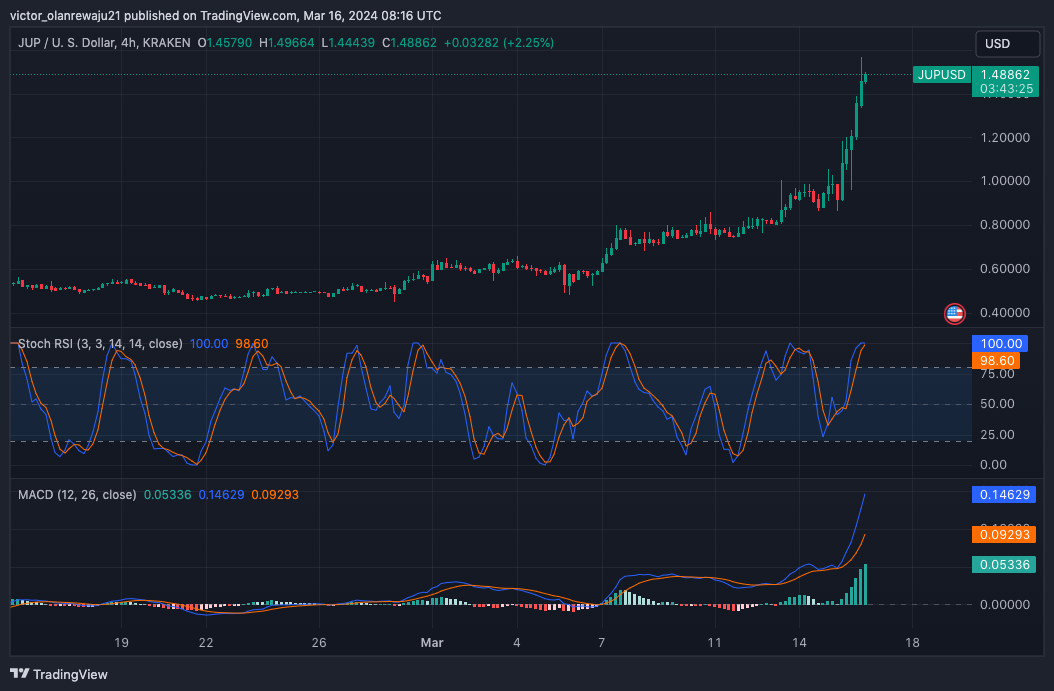
- The Stochastic RSI on the JUP 4-hour chart validated a bullish thesis that could drive it toward $2.
- SEI was overbought but a continuation of the bullish momentum might send it to $1.50.
Solana-based Pyth Network (PYTH), Jupiter (JUP), and modular blockchain token Sei Network (SEI) registered new all-time highs on March 16. At press time, the price of PYTH was $1.13 thanks to a 28.77% rally in the last 24 hours.
JUP, on the other hand, pumped by 52.05% to hit $1.51 while SEI rallied to $1.14 before it later declined to $1.09 as of this writing. Despite the price performances, analyst Altcoin Sherpa posted that the prices of JUP and PYTH might continue to climb.
In a related post, Sherpa mentioned that SEI was another cryptocurrency that could surge after already increasing by 13x since its launch. “I actually like SEI the most given the consolidation period before. I think this one is a great one to trade right now,” Sherpa explained in the post on X.
Pyth Network (PYTH)
Against the USD, PYTH ascended as bulls capitalized on the $0.85 support. Later on, the surge in buying pressure was able to help the token clear the $0.90 resistance line. This move helped validate the long-term breakout.
As of this writing, PYTH had not faced any rejection that could warrant a retracement. If this continues to be the case, the Fibonacci extension showed that the price might climb as high as $1.57.
Should traders decide to book profits, PYTH might drop back to the $0.90 resistance. However, the On Balance Volume (OBV) indicated that the token might not succumb to the downward trend as the indicator reflected a positive volume.
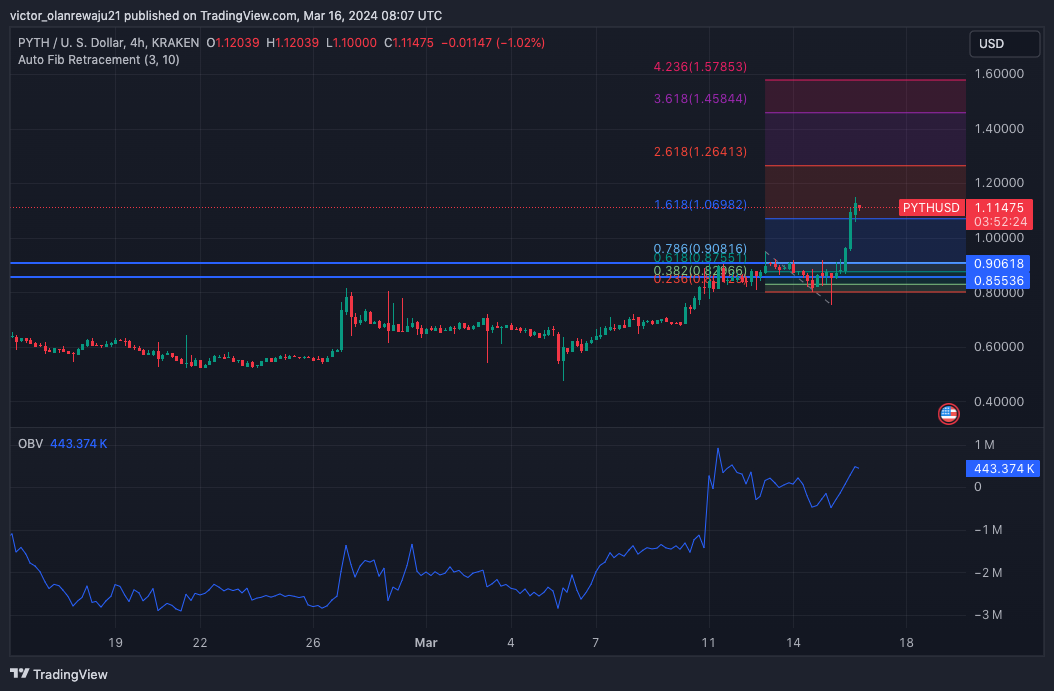
The OBV increase suggests that market players were buying the token in droves. If this continues, then PYTH’s price might surpass its recent all-time high.
Jupiter (JUP)
On the 4-hour JUP/USD chart, the stochastic RSI reading was significantly overbought, indicating that there could be a change in the momentum.
However, the blue K-line had crossed over the orange D-line, hinting at a sustained buying pressure. While the value of the token might decline a bit, a bounce in the $2 direction seemed likely. However, a downward crossover of the K-line below the D-line might invalidate the bullish bias.
A look at the Moving Average Convergence Divergence (MACD) indicated a solid buying momentum for JUP. The positive reading of the MACD is generally perceived as a cue for higher price. Should this remain the case, JUP might accelerate its bullish movement.
Sei Network (SEI)
At press time, SEI’s attempt to hit $1.15 was rejected. However, Coin Edition noticed that SEI’s breakout could be linked to the cup-and-handle pattern on the 4-hour chart. This pattern marks a bullish continuation after a cryptocurrency has remained in consolidation for a while.
With the formation, SEI was able to break out and blast past the $0.93 resistance. At press time, the RSI reading was above 70.00, indicating that the token was overbought. This highly-bullish momentum could halt SEI’s uptrend while dragging the price downwards.
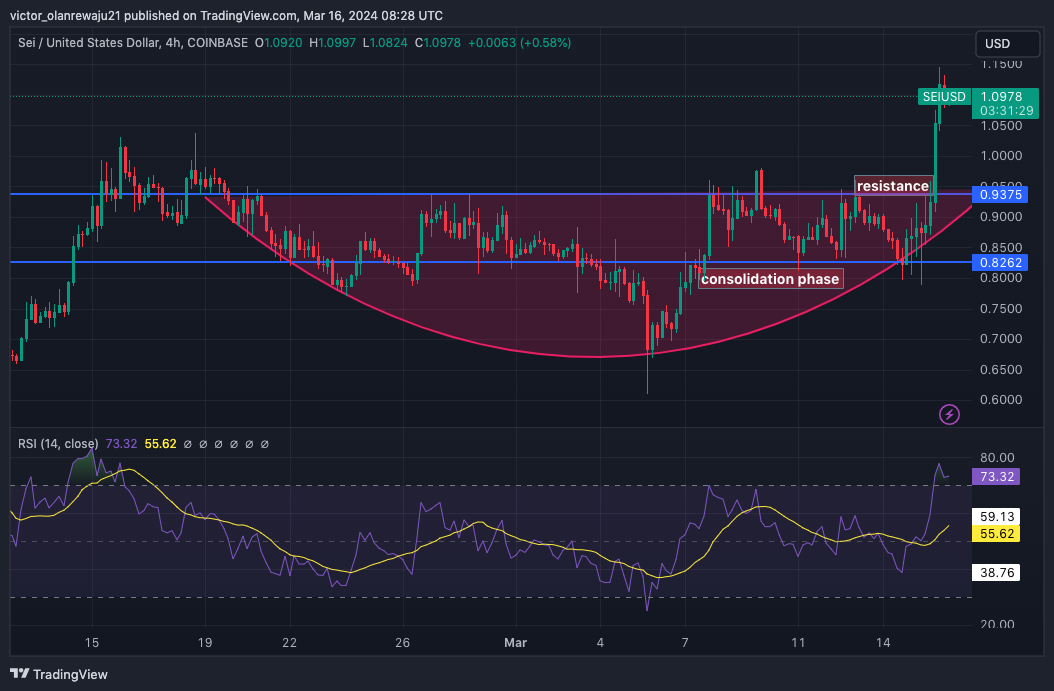
In a highly bearish situation, SEI’s price could reverse to the $0.93 resistance. However, a continuation of the uptrend remains possible. If this is the case, the price of the token might extend toward $1.50.
Disclaimer: The information presented in this article is for informational and educational purposes only. The article does not constitute financial advice or advice of any kind. Coin Edition is not responsible for any losses incurred as a result of the utilization of content, products, or services mentioned. Readers are advised to exercise caution before taking any action related to the company.

: What Happens If You Use an Unlicensed Platform?")


