


- LUNC market shows a bullish trend with increasing trading volume and market capitalization.
- Rising Keltner bands suggest a potential for a continued upward trend in LUNC price.
- Positive BBP and Fisher Transform signals indicate buying opportunities for LUNC traders.
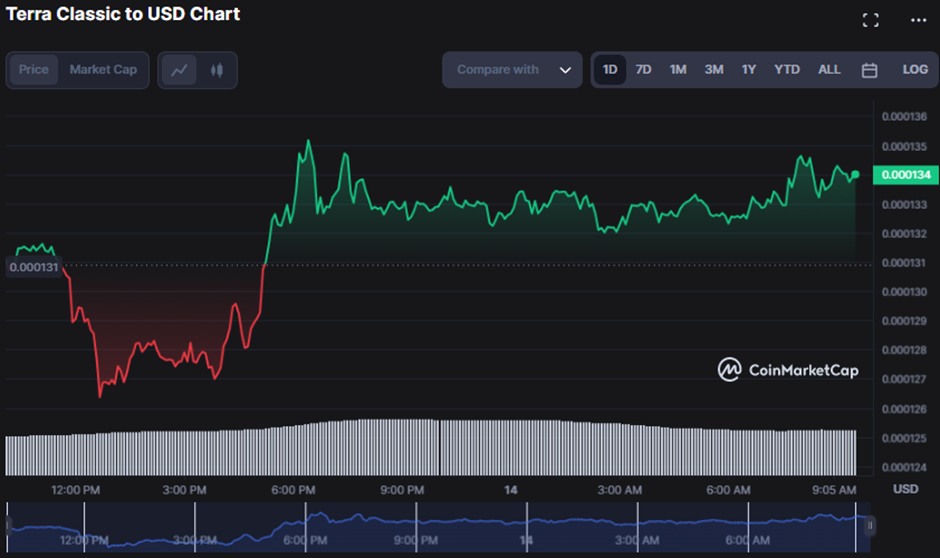
Bearishness in the Terra Classic LUNC market faded when the market found support at the intraday low of $0.0001264. The bulls reclaimed the market, sending the LUNC price to an intra-day high of $0.0001352 before hitting resistance. This bullish trend continued until press time, when the LUNC was valued at $0.0001338, representing a 2.22% gain.
Traders jumped into the market in the prospect of a protracted bullish rebound, prompting market capitalization and 24-hour trading volume to increase by 2.26% and 14.83%, respectively, to $788,400,392 and $99,497,302. This increase demonstrates traders’ belief in the market’s potential for development and profitability, which may result in more investments and expansion soon.
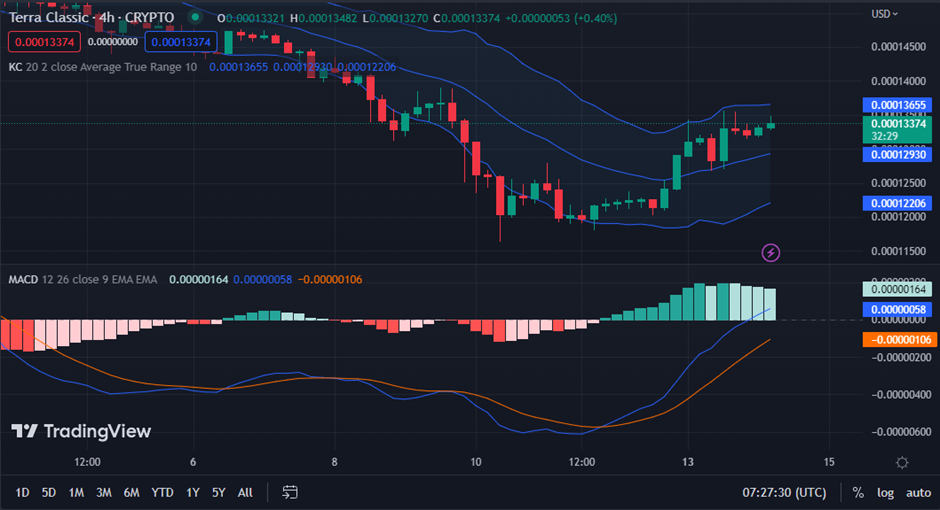
According to a 4-hour chart of LUNC’s price, the rising Keltner Channel bands indicate that the present bullish trend might continue soon. The top bar reaches a high of 0.00013655 and the lower bar a low of 0.00012206, demonstrating the upward trend and the rising volatility of the market.
Traders may seek buying opportunities when the price bounces off the lower band or breaks above the higher band with significant trading volume.
As the price action is forming green candlesticks and heading toward the upper band, this may be a positive sign, and investors may want to consider buying the asset to take advantage of any gains.
Since the MACD blue line has lately moved into the positive zone at a level of 0.00000058, supporting the bullish attitude, this may encourage traders to initiate a long position as purchasing momentum seems to be picking up steam. In addition, the histogram’s green bars are growing in size, suggesting a continued upward trend that may encourage traders to add to their existing holdings.
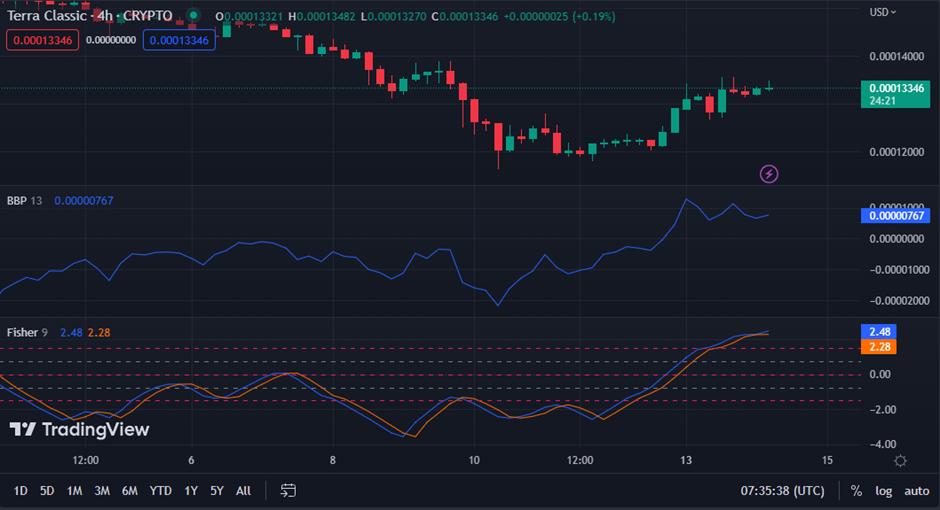
The Bull Bear Power (BBP) movement northwards and LUNC price chart reading of 0.00000760 indicate that purchasing pressure is building and the bulls are gaining market control, signalling a likely bullish trend.
Since the BBP evaluates the strength of buyers and sellers, a positive value indicates that buyers are gaining momentum. Traders could consider buying LUNC while the BBP continues to be positive and the price remains above the upper Keltner band.
With a value of 2.48, the Fisher Transform climbs above its signal line, confirming LUNC’s upward trend and making it a potentially rewarding investment possibility for traders. Nonetheless, traders may consider getting out of the position and limiting their losses if the price drops below the signal line.
The LUNC market sees a bullish rebound with rising Keltner Channel bands and increasing trading volume, attracting investors for potential gains.
Disclaimer: The views, opinions, and information shared in this price prediction are published in good faith. Readers must do their research and due diligence. Any action taken by the reader is strictly at their own risk. Coin Edition and its affiliates will not be liable for direct or indirect damage or loss.
Disclaimer: The information presented in this article is for informational and educational purposes only. The article does not constitute financial advice or advice of any kind. Coin Edition is not responsible for any losses incurred as a result of the utilization of content, products, or services mentioned. Readers are advised to exercise caution before taking any action related to the company.

 Price Prediction 2026, 2027, 2028, 2029, 2030-2050")


