


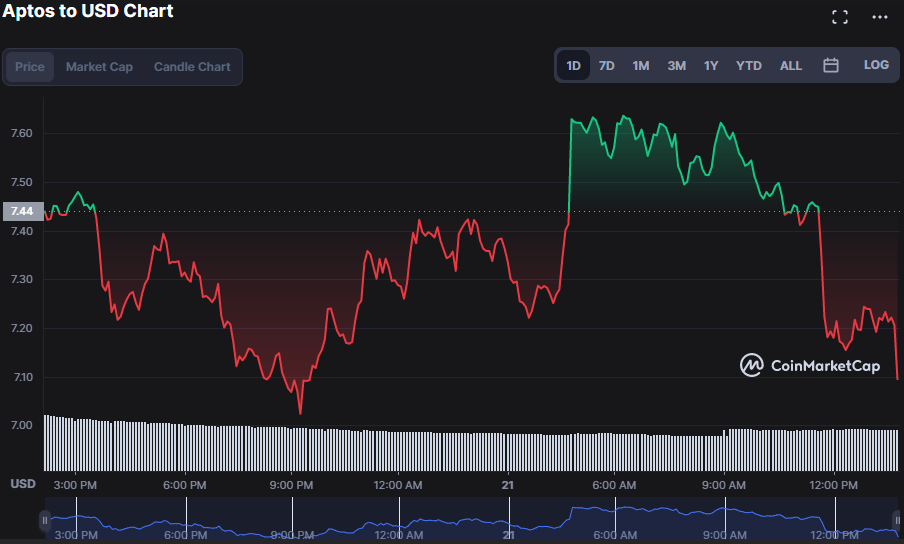
- The price of Aptos drops by 2.15% to $7.15 in the last 24 hours.
- Technical indicators predict that the downward price trend for APT could continue.
- The community asks: can the bulls step in and stop the bearish trend from progressing?
According to Aptos price analysis, APT has been experiencing nightly significant declines as it retraces from highs of $7.66. As of press time, APT had dropped to a low of $7.15.
Additionally, the market capitalization and trading volume have declined by 3.72% and 28.70%, respectively, to $921,129,910 and $577,956,695, respectively.
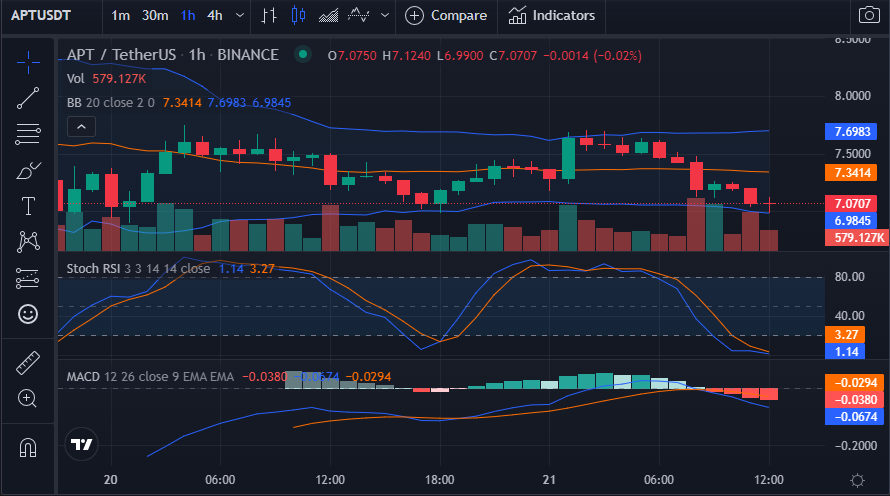
The daily charts’ technical indicators show that the past 24 hours have seen a big decline in the APT price due to selling pressure.
The upper band of the Bollinger Bands is touching at 7.6983, while the lower band is touching at 6.9845. This indicates that the bands are diverging. This shows that the market volatility is dramatically rising as a result of the price swings and selling activity seen today. Adding on, the market is trending toward the lower band indicating a negative momentum.
The MACD blue line has a reading of -0.0674 and is heading below the signal line, indicating a downward momentum in the price movement of APT.
With a score of 1.14, the stochastic indicator is oversold and continuing its downward trend. This indicates that there may still be a bearish trend in the market.
When the 5-day MA crosses below the 20-day MA on the price chart, a bearish crossover is signaled. The 5-day MA is at 7.3412 and the 20-day MA is at 7.1549. The market is in a negative trend as it is below the Moving Averages.
On the 1-hour price chart, the Relative Strength Index (RSI) touches at 42.28. The RSI position indicates that there is greater potential for the digital currency to continue its trend as the bears tighten their grip on APT pricing.
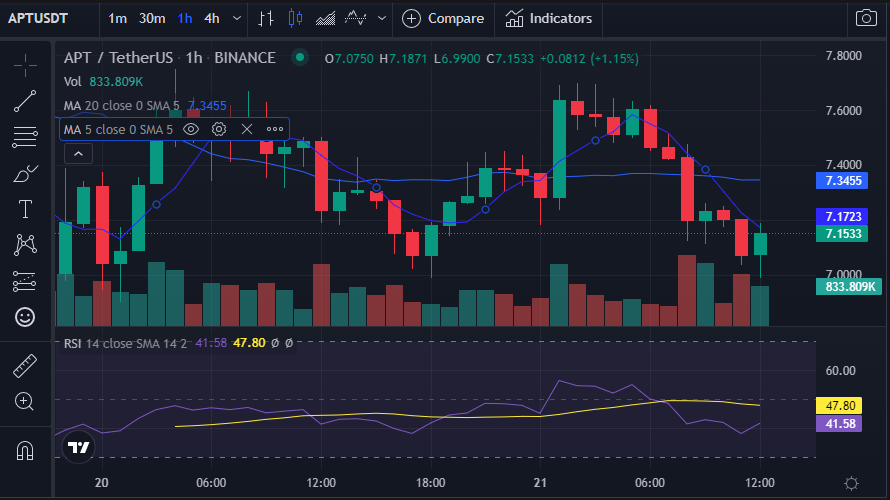
Overall, bulls must hold the resistance level and push prices higher in order to invalidate the current bearish trend on the charts.
Disclaimer: The views and opinions, as well as all the information shared in this price prediction, are published in good faith. Readers must do their research and due diligence. Any action taken by the reader is strictly at their own risk. Coin Edition and its affiliates will not be held liable for any direct or indirect damage or loss.
Disclaimer: The information presented in this article is for informational and educational purposes only. The article does not constitute financial advice or advice of any kind. Coin Edition is not responsible for any losses incurred as a result of the utilization of content, products, or services mentioned. Readers are advised to exercise caution before taking any action related to the company.
: What Happens If You Use an Unlicensed Platform?")


