


- SFP, CSPR, SNX, MKR, and FXS were the best performers over the past 24 hours according to CoinMarketCap.
- Technical indicators for SFP, CSPR, and MKR suggested that their prices may break out soon.
- Meanwhile, SNX and FXS will need to overcome sell volume on their charts before they can continue to rise.
The global cryptocurrency market cap increased 0.20% over the past 24 hours — boosting the market’s valuation to around $1.05 trillion according to CoinMarketCap. During this period, SafePal (SFP), Casper (CSPR), Synthetic (SNX), Maker (MKR), and Frax Share (FXS) were the top performers. Furthermore, indicators suggested that their prices may continue to rise.
SafePal (SFP)
SFP was changing hands at $0.5596. This was after the altcoin printed the biggest 24-hour gain in the market, with its price climbing an impressive 7.98% during this period.
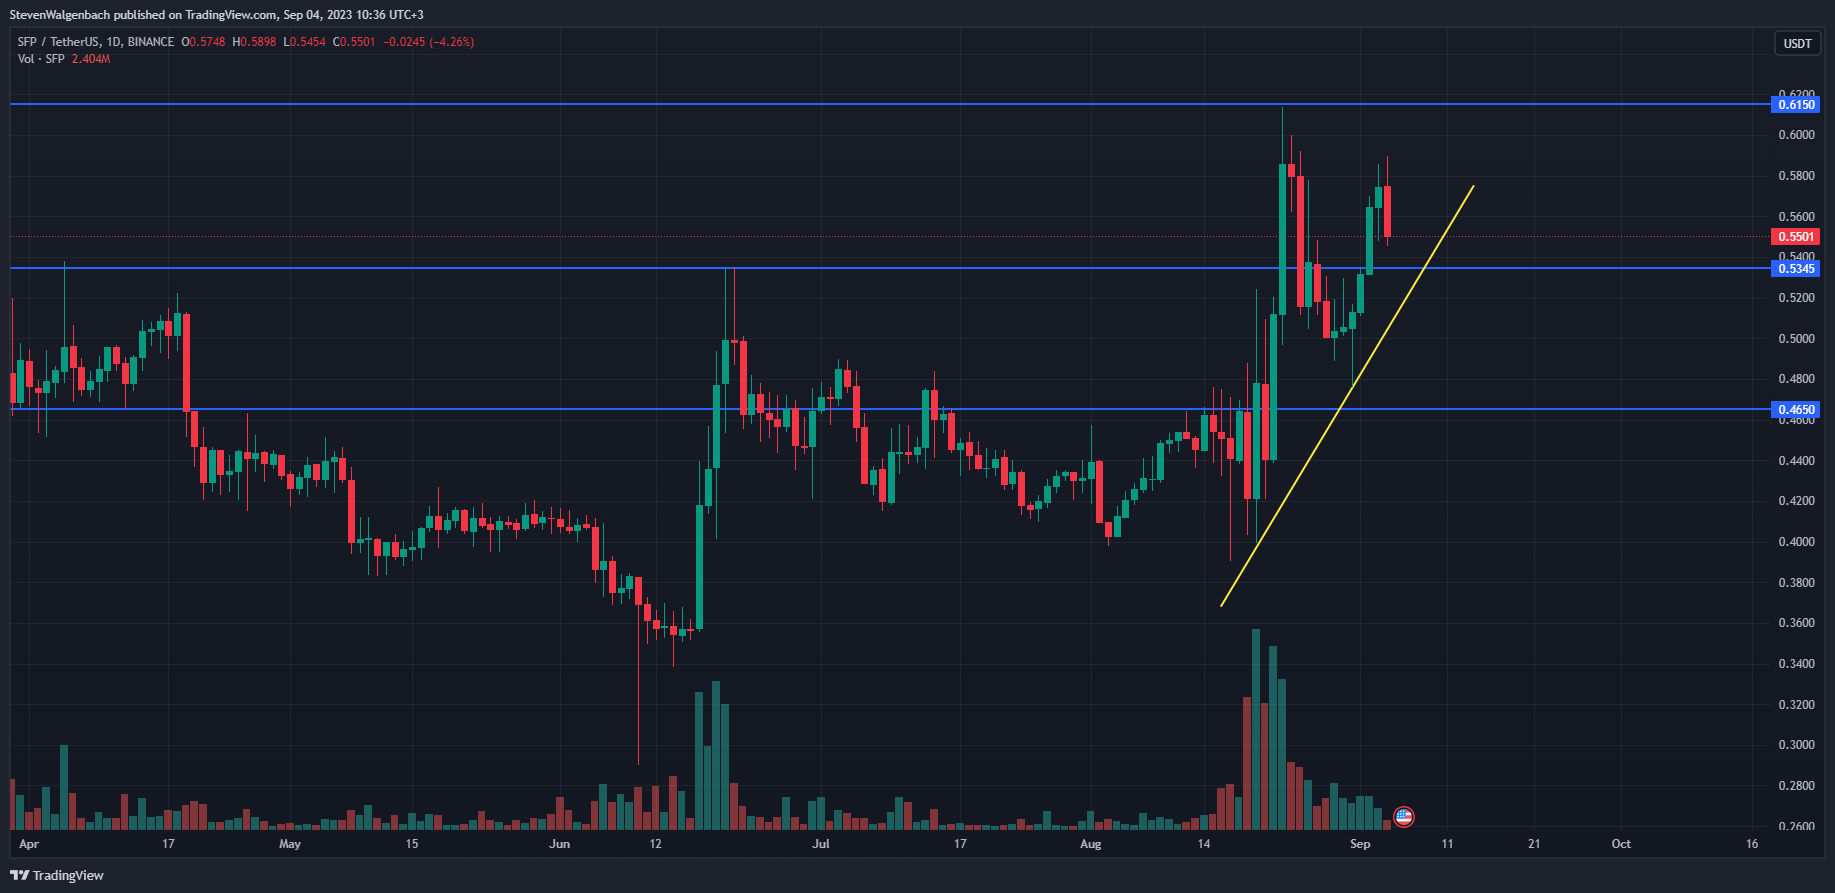
From a technical perspective, SFP’s price was able to break above the key resistance level at $0.5345 over the past 72 hours and continued to trade above the mark at press time. Furthermore, a positive trend line had formed on the altcoin’s daily chart after SFP’s price printed higher lows and higher highs throughout the past couple of weeks.
If this bullish trend continues, then SFP’s price may attempt to challenge the next significant mark at $0.6150 over the coming week. On the other hand, if the cryptocurrency’s price breaks below the positive trend line, then it may be at risk of falling to the next crucial support level at $0.4650.
Casper (CSPR)
Meanwhile, CSPR’s price stood at $0.03599 after it climbed 2.95% throughout the previous day of trading. Although its price increase during the previous 24-hour cycle was notably less than that of SFP’s, its 24-hour performance was enough for it to earn the 2nd position on CoinMarketCap’s gainers list.
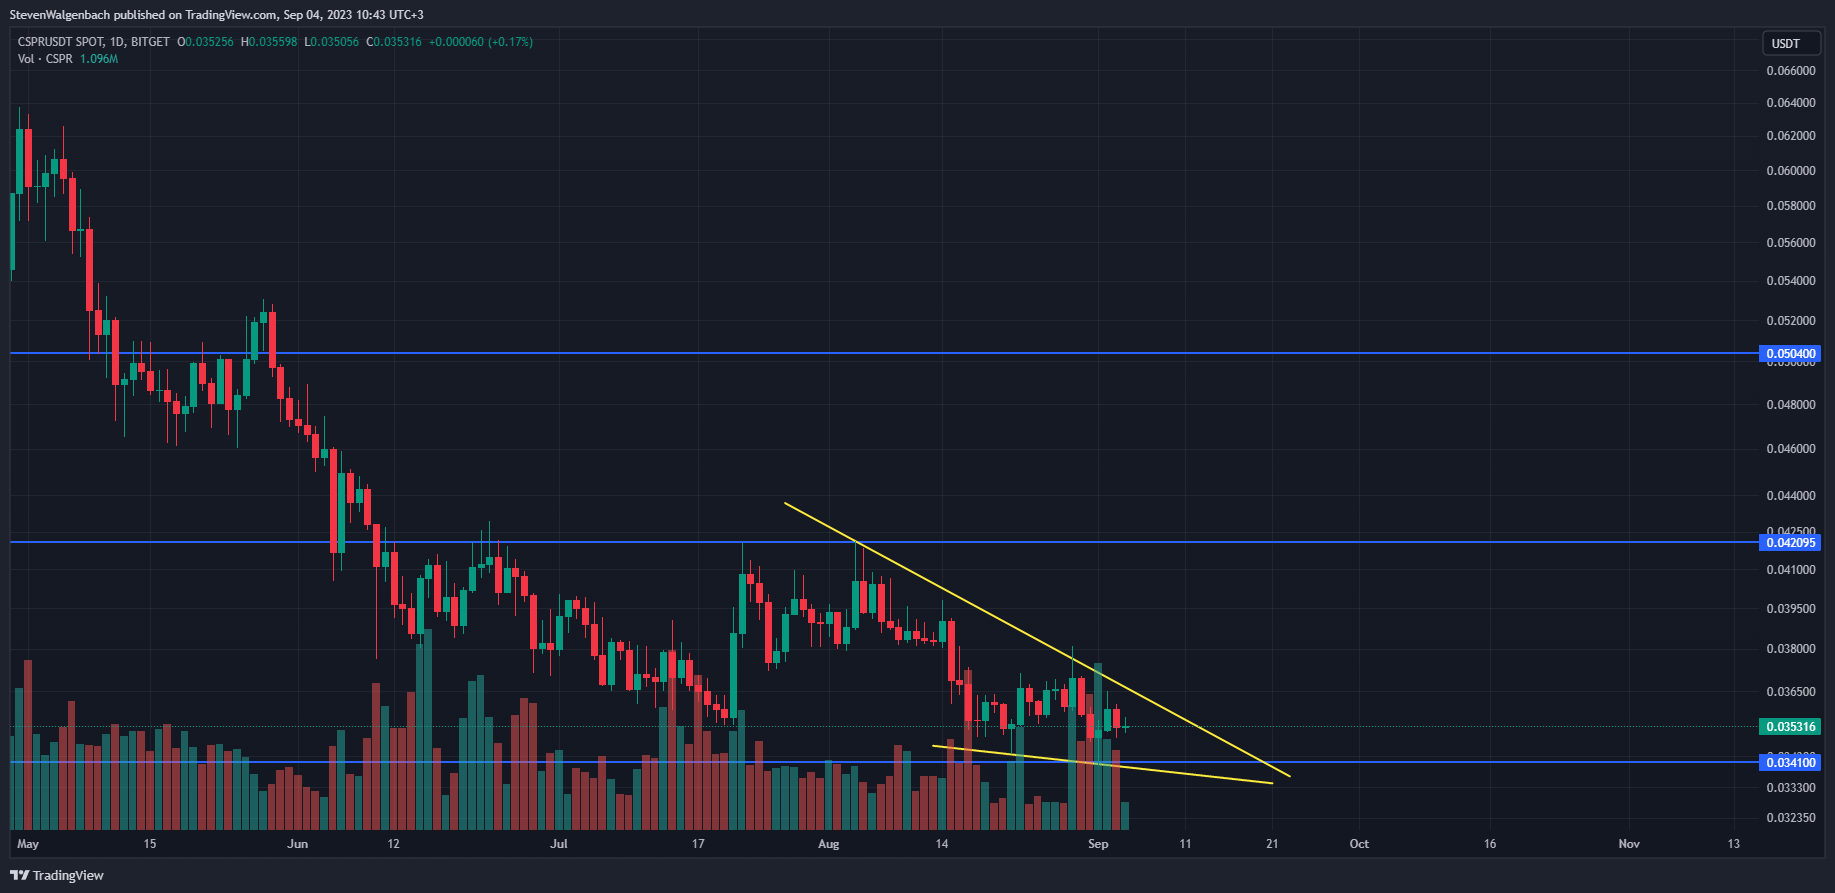
A descending wedge chart pattern on CSPR’s daily chart suggested that the altcoin’s price may break out toward the upside in the coming 2 weeks. If this bullish technical pattern is validated, then the altcoin’s price may make a move towards the $0.042095 resistance level.
Continued buy support may even propel CSPR’s price to $0.050400 before the end of this month. On the other hand, if the cryptocurrency’s price continues to drop in the next few days, then it may challenge the $0.034100 support.
Synthetix (SNX)
The third best performer over the past 24 hours was SNX after its price rose 2.61%. Subsequently, the cryptocurrency was changing hands at $1.97 at press time. Along with its increase in price, SNX also recorded a 377.15% uptick in its 24-hour trading volume. As a result, the total trading volume for SNX was estimated to be $96,817 million.
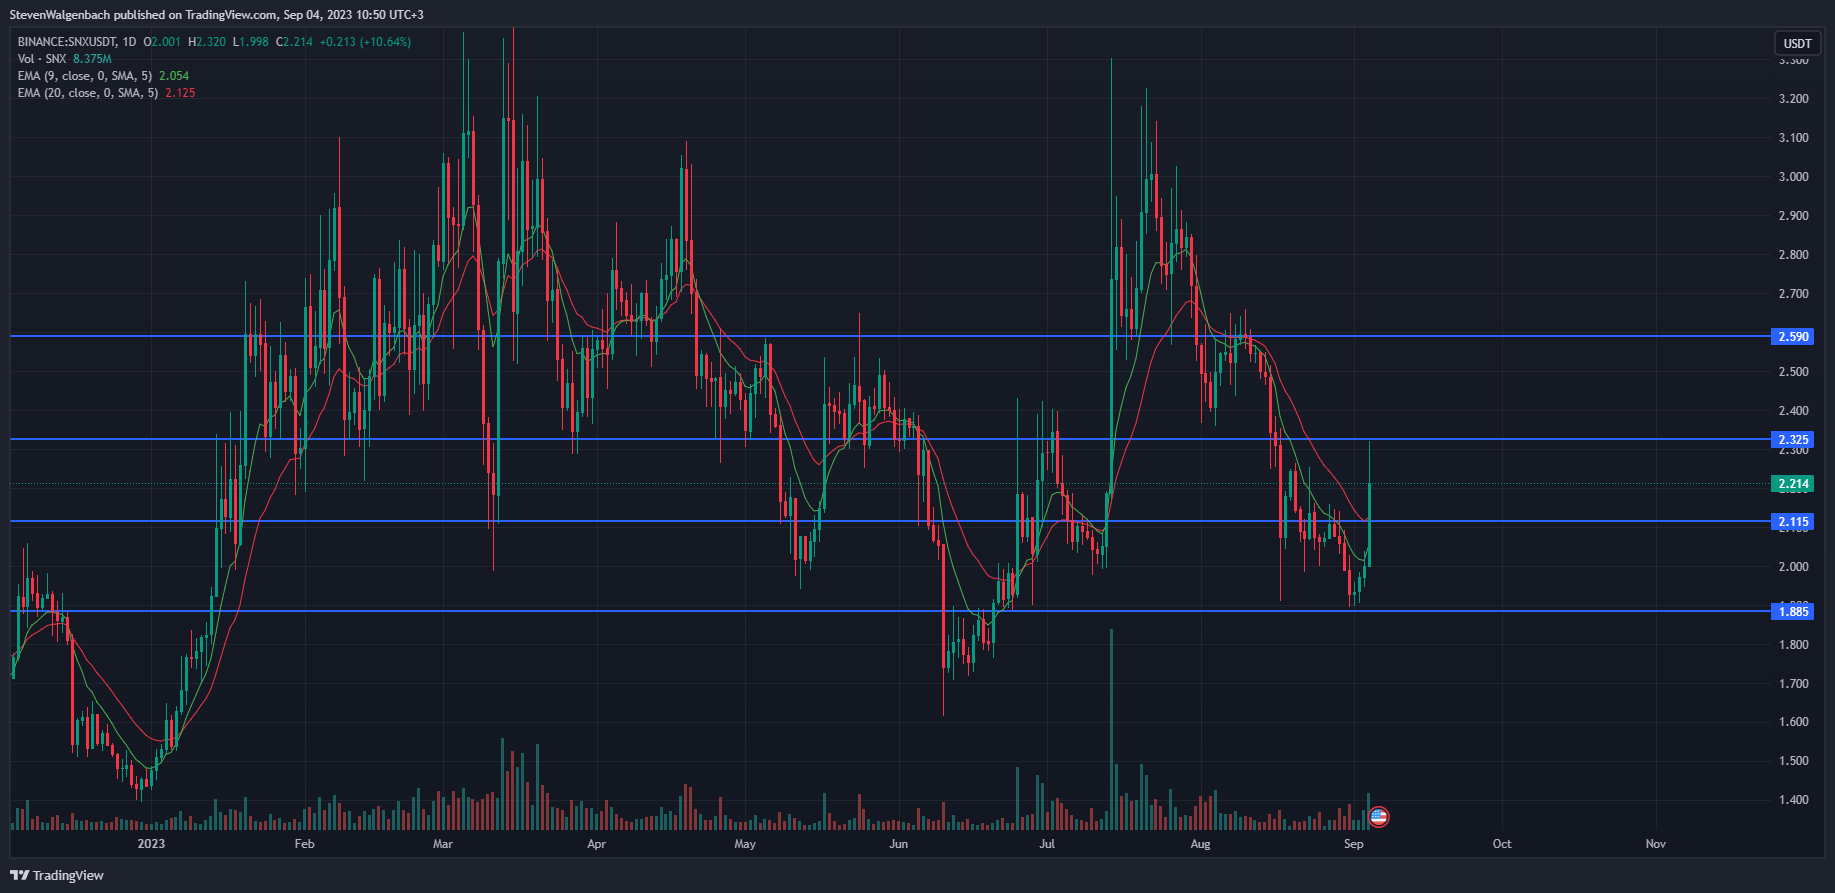
SNX’s price was able to break through the $2.115 over the past 24 hours and had also attempted to do the same with the next key barrier at $2.325, but was rejected by the level. As a result, SNX’s price had retraced to its current level.
If SNX is able to close today’s daily candle above $2.325, then it will have a clear path to rise to $2.590 in the following few days. During this time, the 9-day EMA line may also cross above the 20-day EMA line, which will signal a bullish shift in SNX’s short-term momentum.
Should these technical indicators cross, SNX may have the buy support needed to flip the $2.590 resistance into support. On the other hand, if SNX closes today’s daily candle below $2.115, then it may be at risk of dropping to $1.885 in the next few days.
Maker (MKR)
Just behind SNX was MKR with its price increase of 2.34%. This latest gain boosted the altcoin’s price to $1,152.70 at press time. The positive daily performance also resulted in MKR’s price trading closer to its 24-hour high of $1,158.99. Meanwhile, its daily low sat at $1,088.05.
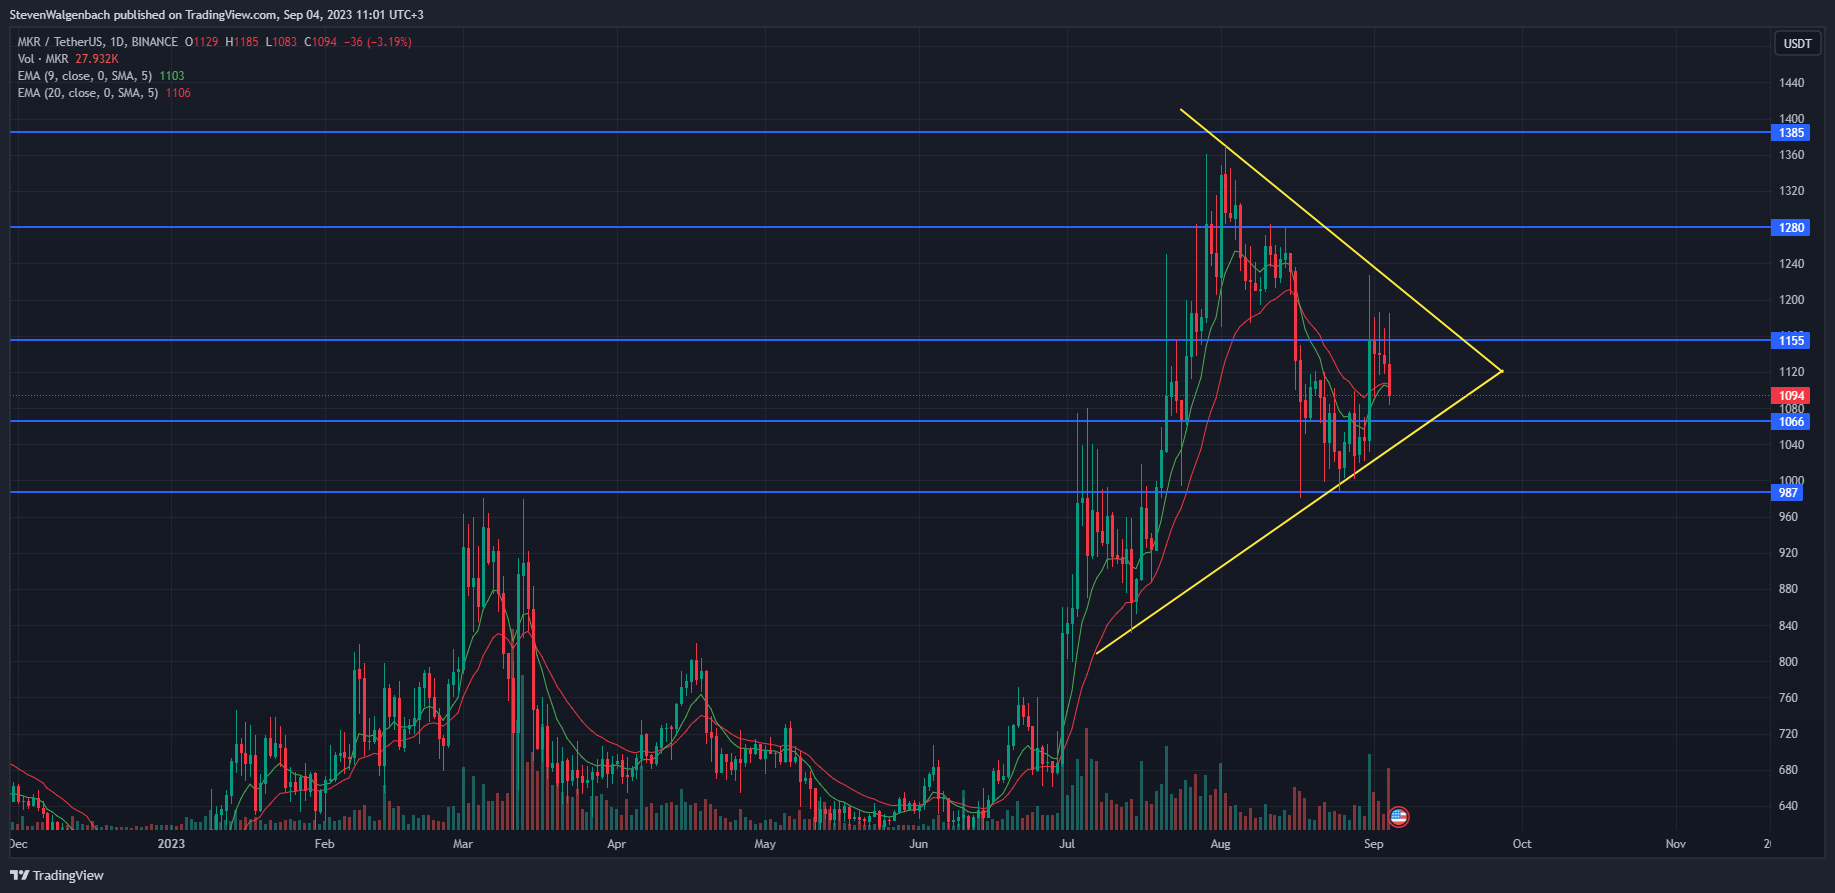
The potential for a breakout in MKR’s price within the upcoming days is heightened due to the emergence of a symmetrical triangle chart pattern on the daily chart of the cryptocurrency. Should this breakout favor an upward movement, MKR’s price might strive to convert the $1,280 support level into support before continuing to rise to $1,385 during the coming few days.
On the other hand, if a bearish breakout occurs, there is a risk that the altcoin could test the crucial support level at $1,066. Subsequent to that, persistent selling pressure could drive the altcoin’s value down further to reach a low of $987 in the following week.
Analyzing technical indicators, the likelihood of a bullish breakout appears more plausible due to the imminent activation of a noteworthy short-term technical flag. Presently, the 9-day Exponential Moving Average (EMA) line is attempting to intersect above the 20-day EMA line.
If these two indicators successfully cross within the next 48 hours, it will signify a shift in short-term momentum favoring the bullish side, potentially leading to an increase in MKR’s price over the following few days.
To confirm the bullish breakout, it is important for MKR’s price to conclude a daily candle above the $1,155 level. Conversely, if MKR fails to achieve this candle close above the stated threshold within the subsequent 72 hours, it could result in a substantial decline in the altcoin’s value.
Frax Share (FXS)
Number 5 on the list of top gainers was FXS after its price printed a 24-hour gain of 2.06%. As a result, the cryptocurrency’s price was elevated to $5.70. Despite the positive daily performance, the altcoin’s weekly performance remained entrenched in the red zone at -5.21% at press time.
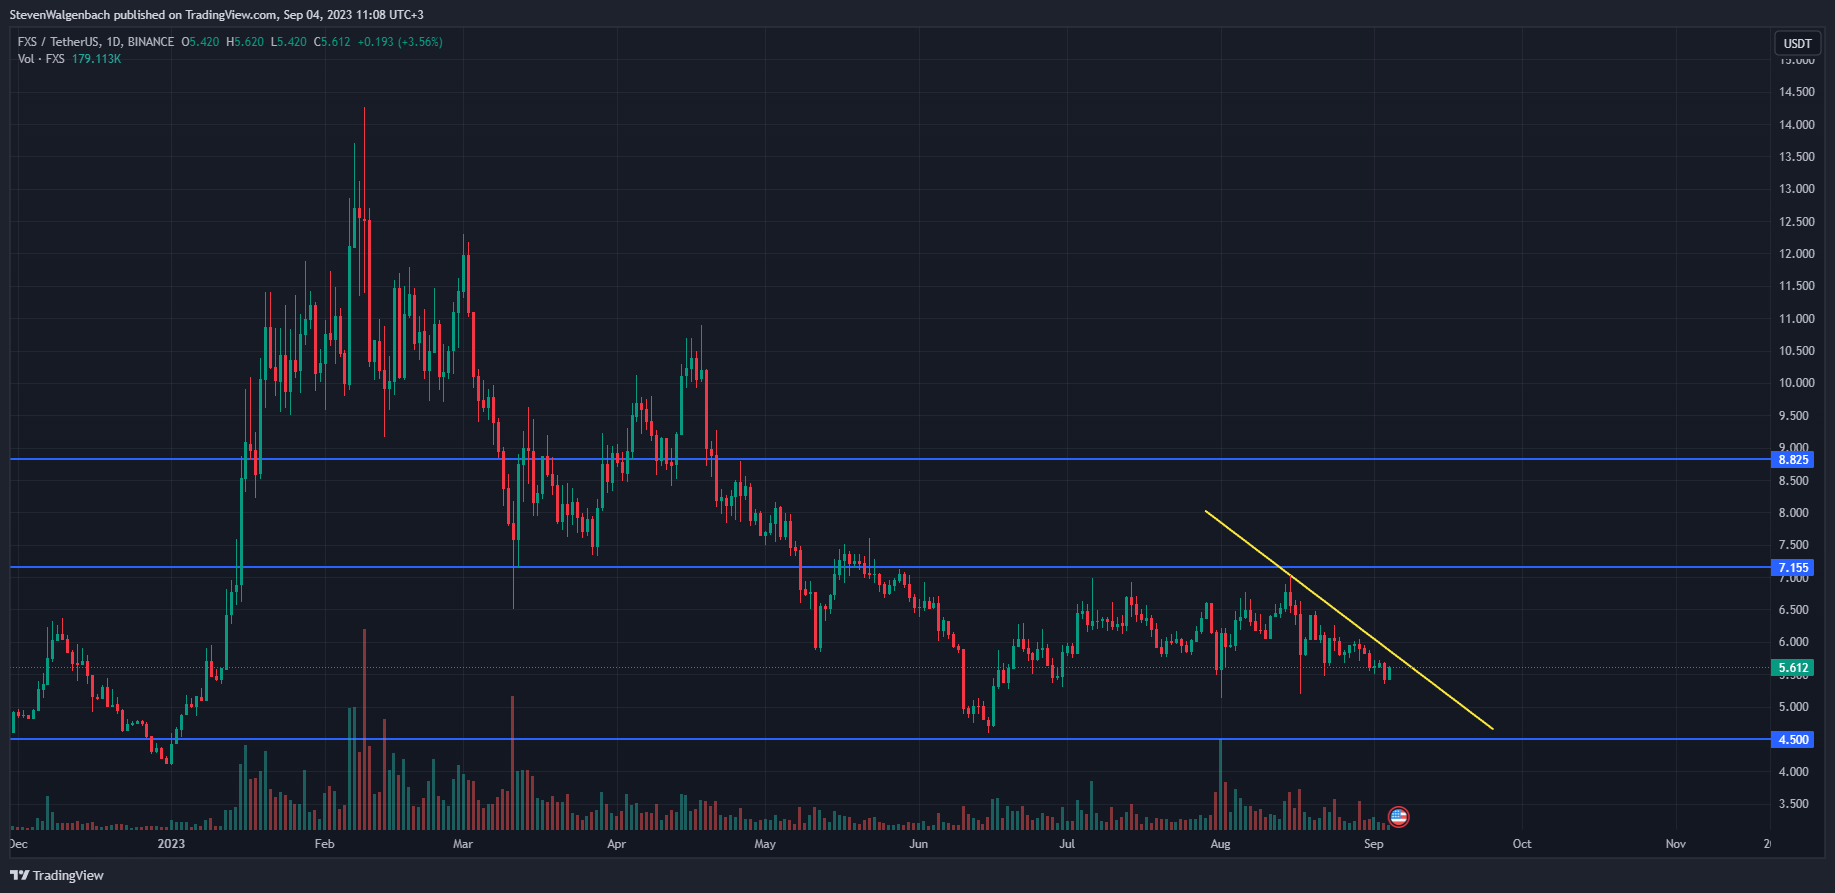
The price of FXS had been in a negative trend over the past couple of weeks after the cryptocurrency’s price printed lower highs during this period. Moreover, a negative trend line had also formed on the altcoin’s daily chart.
If the altcoin’s price continues to fall, then it may potentially retest the crucial support level at $4.500 in the next 2 weeks. However, if FXS is able to close a daily candle above the negative trend line, and not fall back below the trend line thereafter, then it may begin an ascent towards $7.155.
Disclaimer: The views and opinions, as well as all the information shared in this price analysis, are published in good faith. Readers must do their own research and due diligence. Any action taken by the reader is strictly at their own risk. Coin Edition and its affiliates will not be held liable for any direct or indirect damage or loss.
Disclaimer: The information presented in this article is for informational and educational purposes only. The article does not constitute financial advice or advice of any kind. Coin Edition is not responsible for any losses incurred as a result of the utilization of content, products, or services mentioned. Readers are advised to exercise caution before taking any action related to the company.


