
- A Continued Bullish trend for SHIB could breach the $0.00000850 resistance level.
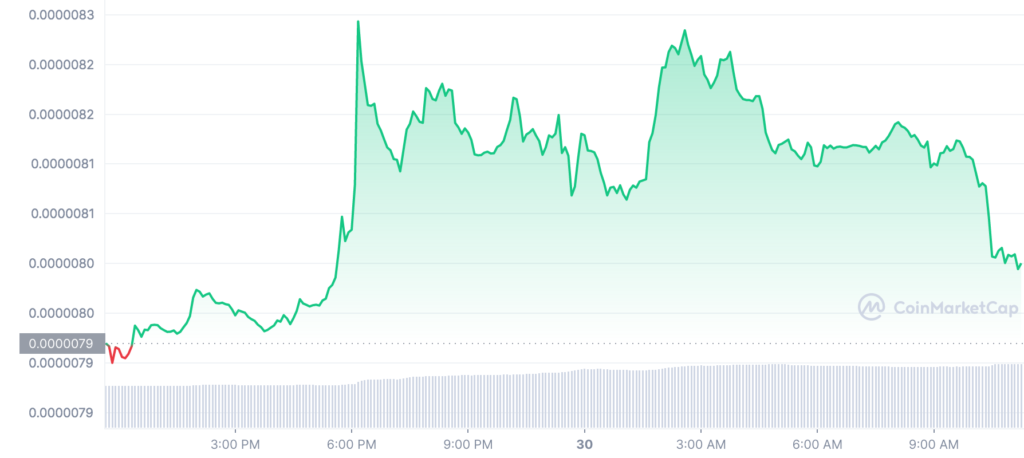
- SHIB price has risen by 1.30% over the past 24 hours.
- Bear’s strength could reverse SHIB’s trend to below $0.0000080.
Shiba Inu (SHIB) buyers have been in charge since the start of the day, erasing the impact of the downward trend that had driven prices to support at $0.00000793. The bulls were able to raise the price of SHIB to $0.00000801 (a 1.30% increase), at the time of writing, despite resistance at the day’s intraday high of $0.00000820.
The capitalization increased due to the favorable control by 1.30% to $4,398,131,103. whereas the amount has increased by 53.75 percent to $153,415,595. This drop in volume can be a sign that it’s time to sell MKR and make a profit.
According to SHIB price analysis, a break of the current levels of resistance will confirm an uptrend and allow for more increases in the near future, which may push the price over $0.0000085.
Investors may utilize this as an entry opportunity for more purchases given the strong support at $0.00000793. To maintain bullish momentum on the downside, SHIB price needs to remain above $0.000008. In the short term, prices may decline if the coin surpasses this level and starts a negative trend.
SHIB must prevent a decline through the pivot point at $0.00000812 if it wants to go for the First Major Resistance Level (R1) at $0.00000835. Indicators of a bullish afternoon session include a rebound to $0.0000082. SHIB will most likely take its cues from the larger crypto market and any updates on the Shibarium upgrade
The Second Major Resistance Level (R2) at $0.00000852 would likely be tested by SHIB in the event of a prolonged rally. At $0.00000892, there is the Third Major Resistance Level (R3).
If the pivot were to fall, the First Major Support Level (S1) at $0.00000795 would come into play. SHIB should stay clear of sub-$0.00000780 and the Second Major Support Level (S2) around $0.00000772, though, barring another protracted sell-off.
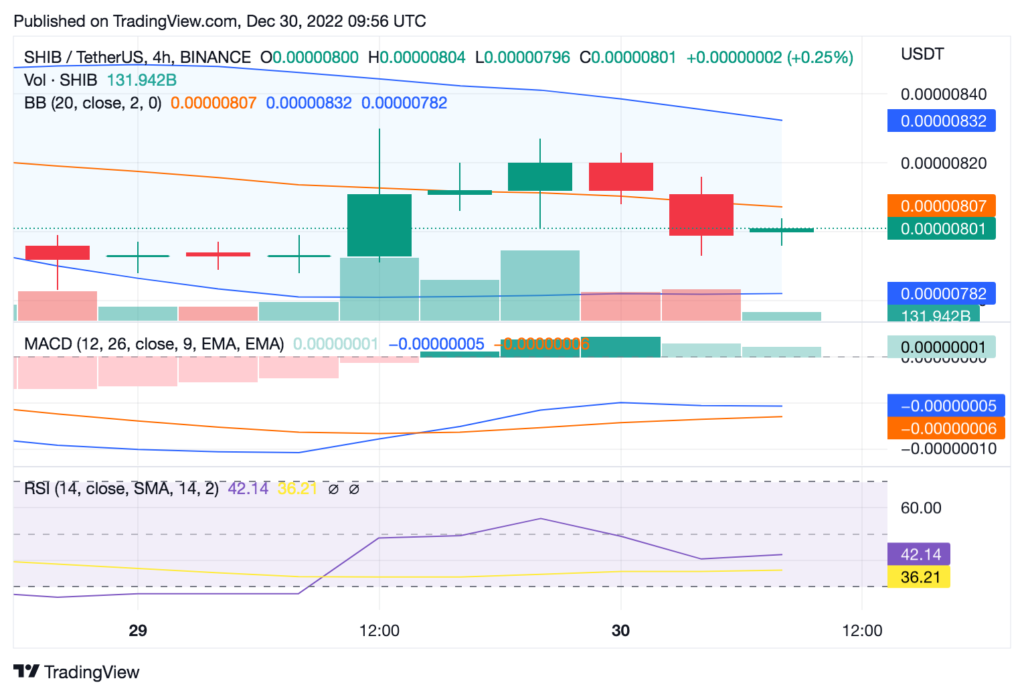
On the four-hour chart, the 50-day EMA is below SHIB, which is currently trading at $0.00000821, sending a bearish signal on the EMAs. The 50-day EMA retreated from the 100-day EMA this morning, and the 100-day EMA retreated from the 200-day EMA. The indicators were negative.
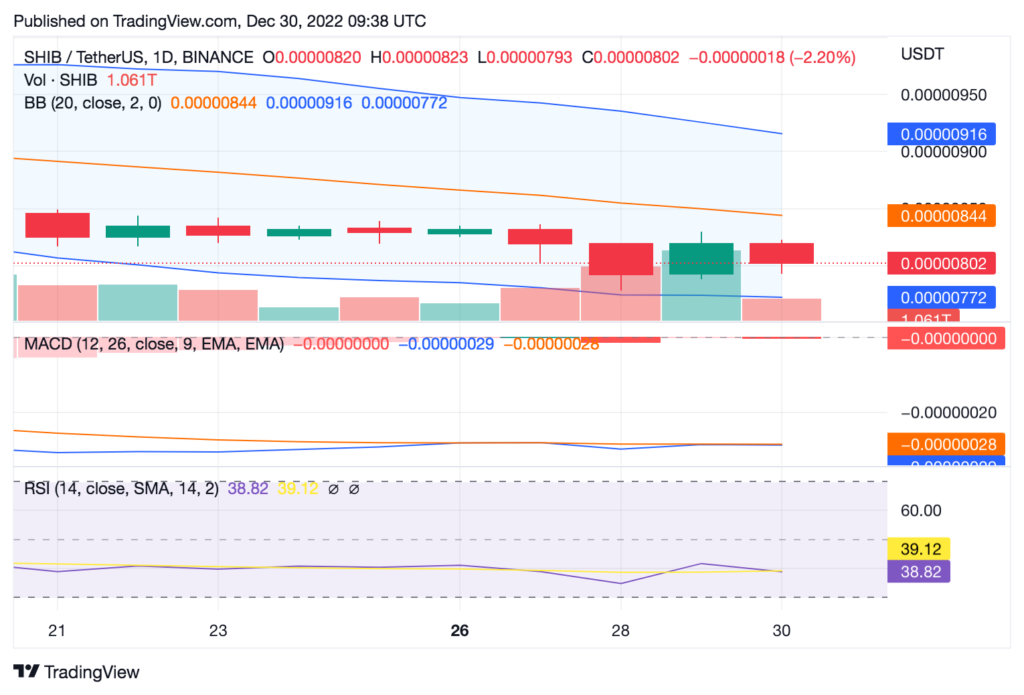
If the bulls are successful, SHIB may breach the resistance after crossing the 200-day MA, which is $0.00000850.
Disclaimer: The views and opinions, as well as all the information shared in this price analysis, are published in good faith. Readers must do their own research and due diligence. Any action taken by the reader is strictly at their own risk, Coin Edition and its affiliates will not be held liable for any direct or indirect damage or loss
Disclaimer: The information presented in this article is for informational and educational purposes only. The article does not constitute financial advice or advice of any kind. Coin Edition is not responsible for any losses incurred as a result of the utilization of content, products, or services mentioned. Readers are advised to exercise caution before taking any action related to the company.


 Price Prediction: UNI Eyes $5 as UNI Extends Bullish Breakout")

