- Shiba Inu price analysis is bearish today.
- The price has receded down to $0.000008888.
- Support for SHIB/USD is found at $0.000008808.
Shiba Inu price analysis indicates that the price is travelling low once again as the bears made a comeback today. The bulls had been at the upper position during the last few days by winning successively and rising to record highs repeatedly. But the trends are shifting as the price is now covering the downward range. The price has come down to the $0.000008888 level because of the successful bearish attempt. A further downfall is likely to continue if the bears remain in power.
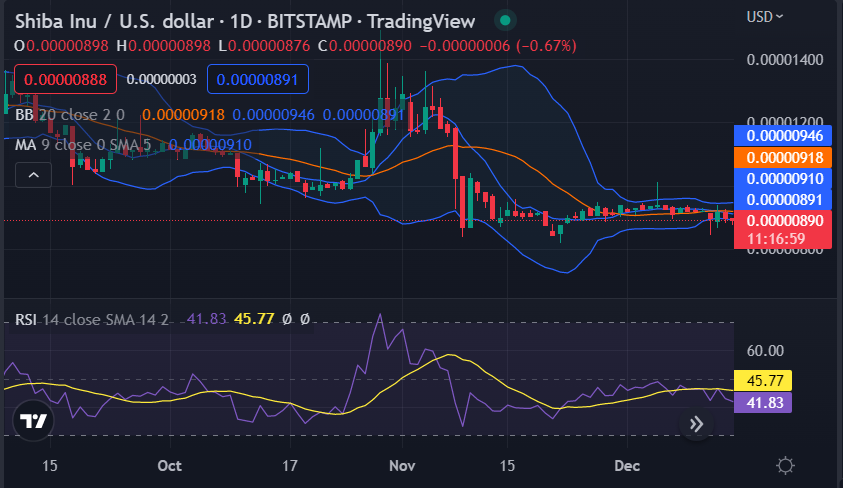
The 1-day Shiba Inu price analysis shows that the price is flowing downwards after the bears made a comeback today. The SHIB confirms the downfall, as the price can be seen degraded to $0.000008888. The past week’s value improved the coin’s value, but the trends have also undergone a slight shift today. The bulls were in control, and the price rose above $0.000009293, but that movement initiated the fall.

The volatility has increased on a great scale, indicating that a downward trend may presume in the future. The Bollinger bands indicator also stands relevant, as its upper value is at $0.00000946, and the lower value is at $0.00000891. The Relative Strength Index (RSI) score has decreased to 45.77 due to the selling activity going on in the market, and the moving average (MA) is standing at $0.00000910 above the price level.
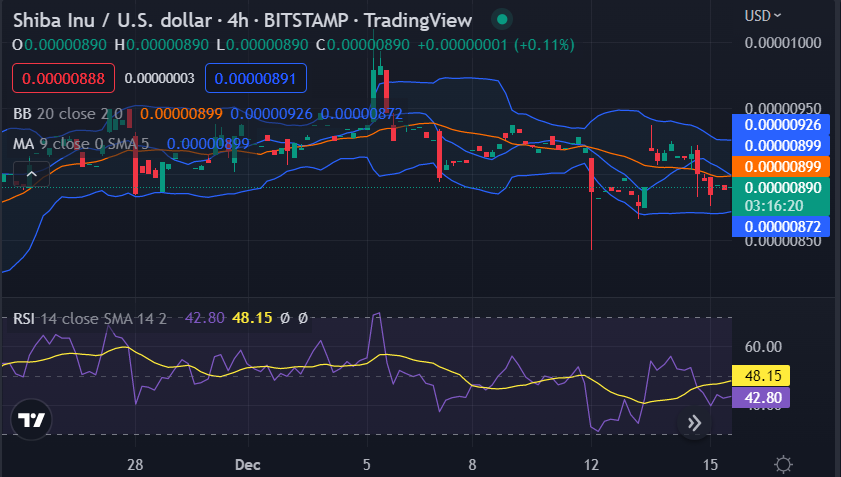
The 4-hour Shiba Inu price analysis shows bears have dominated the price chart for the past few hours, and the price has dropped significantly. This is a disappointing sign for the cryptocurrency, as the chances of a bullish comeback are reducing. The downward trend has taken the price to the $0.000008888 level, and a further price decline can be expected.

The volatility on the 4-hour chart is also high, and the price is trading below the volatility indicator’s mean average line, which is at the $0.00000899 mark. The RSI is again trading low and provides reasoning for fear of a massive loss in SHIB price, as it now shows a steeper downward movement, and it is trading in the lower half of the neutral zone at index 48.15, quite near the undersold zone. The moving average value for the four hours price chart is at the $0.00000899 position.
To sum up, Shiba Inu price analysis suggests that the coin seems to be losing its bullish current completely at the bearish hands, as the price has already stepped below the $0.000008888 critical point, and now it seems like SHIB will continue low before attempting any higher highs. But this is a good time for those waiting to buy the dip, which might trigger the buying impulse, and SHIB may start rising towards its next speculated target of $0.000009211, but for intraday trading, chances are less for a recovery today.
Disclaimer: The views and opinions, as well as all the information shared in this price analysis, are published in good faith. Readers must do their own research and due diligence. Any action taken by the reader is strictly at their own risk. Coin Edition and its affiliates will not be held liable for any direct or indirect damage or loss.
Disclaimer: The information presented in this article is for informational and educational purposes only. The article does not constitute financial advice or advice of any kind. Coin Edition is not responsible for any losses incurred as a result of the utilization of content, products, or services mentioned. Readers are advised to exercise caution before taking any action related to the company.


