


- Technical indicators suggest that SHIB may strengthen 40% against DOGE.
- Fundamental indicators for DOGE look pale after Elon Musk banned DOGE-tipping bot.
- SHIB and DOGE risk dropping 10% and 13% respectively against the dollar this month.
Technical indicators for the meme coin, Shiba Inu (SHIB), suggest that another 40% rally may be in store for the crypto versus Dogecoin (DOGE) as Shibarium comes into focus.
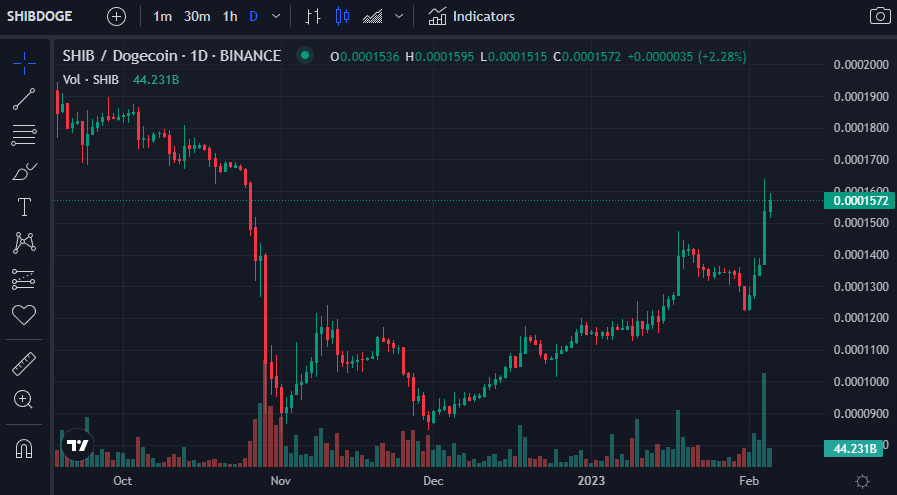
On 4 February, 2023, the SHIB/DOGE pair reached 0.00001638 DOGE, which is almost a 100% increase in the last three months. This comes after it bottomed out at 0.00000993 DOGE – its lowest level on record.
This sharp recovery came as investors’ focus shifted towards the upcoming launch of Shibarium – a Shiba Inu-backed layer-2 blockchain built on the Ethereum mainnet which was announced on 16 Jan, 2023.
The price of SHIB gained momentum amid reports that Shibarium will go live on 14 February, 2023. Meanwhile, fundamental indicators for DOGE looked pale in comparison after Elon Musk suspended a DOGE tipping bot for violating Twitter’s rules.
Several technical indicators currently suggest that the recovery trend is set to continue for SHIB/DOGE in the coming weeks. Furthermore, the pair could climb to 0.00002181 by March of this year if historical cycles are any indication.
Although SHIB appears to be in a better position to outperform DOGE, both cryptos may face headwinds against the dollar this month.
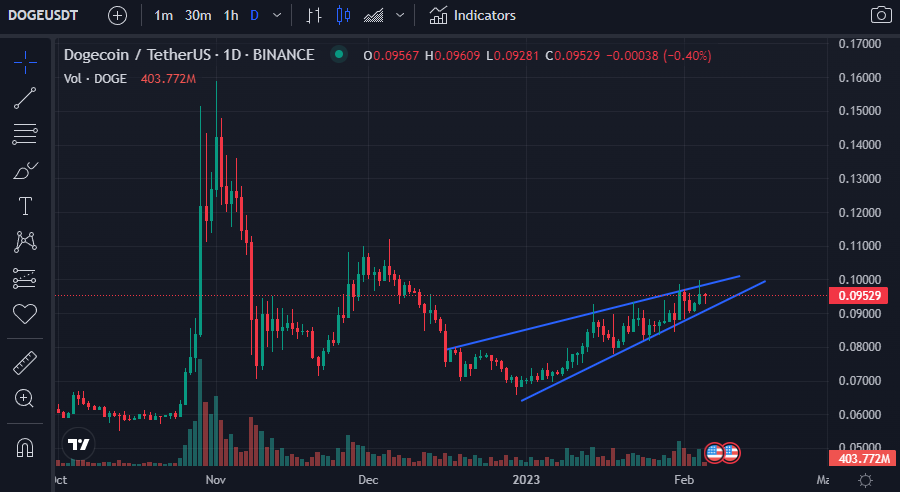
Looking at DOGE’s daily chart, the meme coin may experience a small correction versus the dollar in the coming days as a rising wedge pattern has formed. Should the bearish chart pattern play out, the downside target for DOGE’s price will be $0.0850, which is around 10% from current levels.
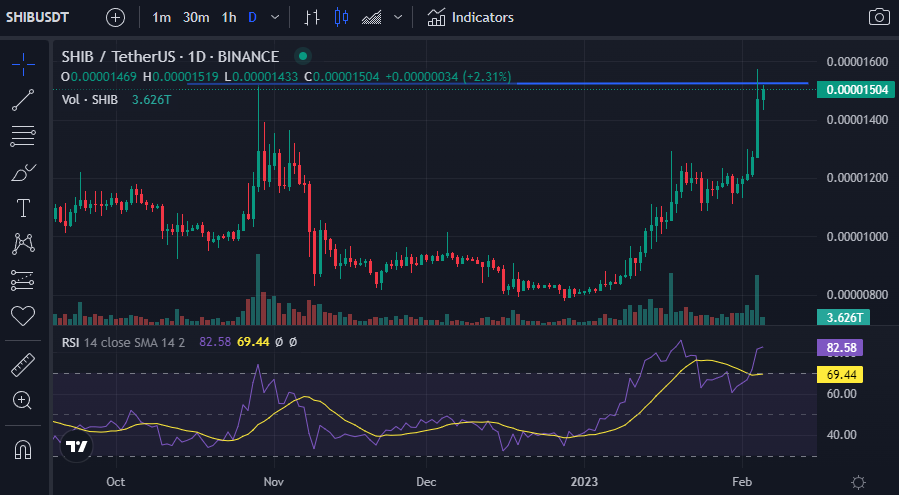
Meanwhile, SHIB/USDT is also overstretched on its daily chart, with the Relative Strength Index (RSI) indicator currently in overbought territory at 82.58. In addition to this, SHIB’s price is currently facing a strong resistance zone around $0.00001517 – where a pullback is likely.
If this pullback takes place, February could see SHIB’s price drop to $0.00001300-$0.000013000, which has been its most active zone in recent months. This would constitute a 13%-20% from current price levels.
Disclaimer: The views and opinions, as well as all the information shared in this price analysis, are published in good faith. Readers must do their own research and due diligence. Any action taken by the reader is strictly at their own risk. Coin Edition and its affiliates will not be held liable for any direct or indirect damage or loss.
Disclaimer: The information presented in this article is for informational and educational purposes only. The article does not constitute financial advice or advice of any kind. Coin Edition is not responsible for any losses incurred as a result of the utilization of content, products, or services mentioned. Readers are advised to exercise caution before taking any action related to the company.
 Price Prediction 2026, 2027, 2028, 2029, 2030 -2050")


