


- SHIB trades at $0.00000474 after a clean five-month descending triangle breakdown
- 24H burn activity surged 60%, crossing 1.1M tokens destroyed in one afternoon
- OI rose 2.72% to $32.69M as $29.55K in long liquidations hit within 24 hours
Shiba Inu trades at $0.00000474 on June 9, bouncing from a multi-month low of $0.00000430 reached days after the five-month triangle on the daily chart finally broke. The only thing bulls can point to right now is a 60% burn spike that landed the same session the chart cracked.
SHIB Daily Chart Breakdown: What the Pattern Is Telling Traders
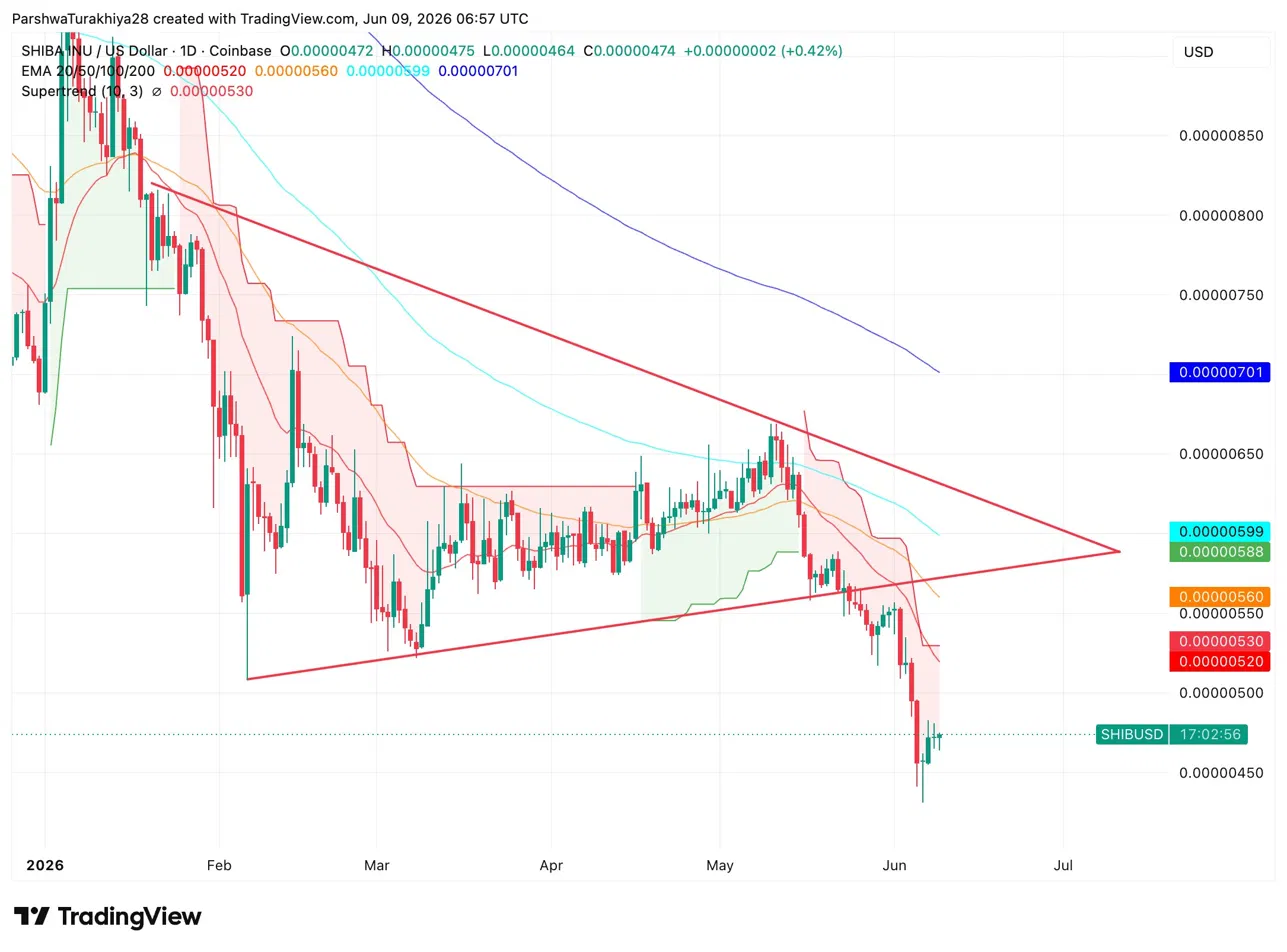
SHIB spent the first half of 2026 coiling inside a descending triangle, printing lower highs from January’s $0.00000850 peak while holding a flat base near $0.00000480. That base broke in early June with back-to-back red candles rather than a wick flush, which gives the breakdown more technical credibility.
Related: Worldcoin (WLD) Price Prediction 2026, 2027, 2028, 2029, 2030-2050
All four EMAs sit above price in bearish order. The 200-day EMA at $0.00000701 is far overhead, and the Supertrend at $0.00000530 flipped red and now acts as first resistance.
- Resistance: $0.00000520 (20 EMA), $0.00000530 (Supertrend)
- Support: $0.00000440, $0.00000420 (triangle measured move target)
SHIB Burn Rate Jumped 60% — Is Supply Pressure Actually Building?
The 24-hour burn chart shows tokens destroyed climbing from roughly 500,000 to over 1.1 million between 15:00 and 20:00 UTC on June 8, a 60% acceleration in under five hours. Bulls will flag this as a supply-side catalyst worth watching.
The 7-day chart pulls that argument back down. Burn activity peaked near 25 million tokens around June 3 before collapsing 71.07% through June 8. One spike day does not rebuild a burn trend, and without follow-through this week, the price impact stays limited.
SHIB Derivatives Analysis: Long Liquidations Are the Story Right Now
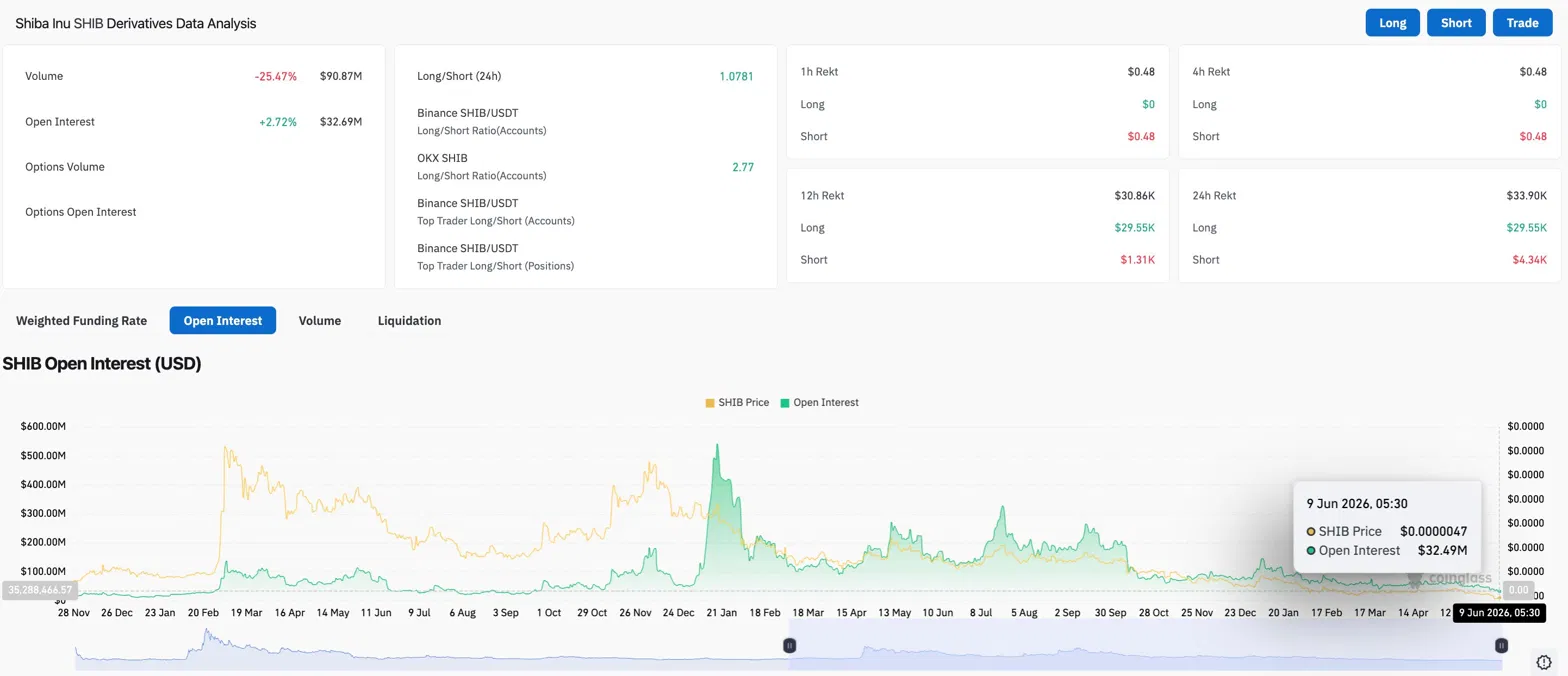
Volume dropped 25.47% to $90.87M while open interest climbed 2.72% to $32.69M. New positions are being added quietly while trading activity slows, pointing to cautious positioning rather than directional conviction. The Binance long/short ratio sits at 1.0781, nearly neutral, while OKX leans more bullish at 2.77.
Over the past 24 hours, $29.55K in long positions were liquidated versus just $4.34K on the short side. Longs are absorbing the pain in this move.
SHIB Hourly RSI Signals the Bounce May Be Running Out of Gas
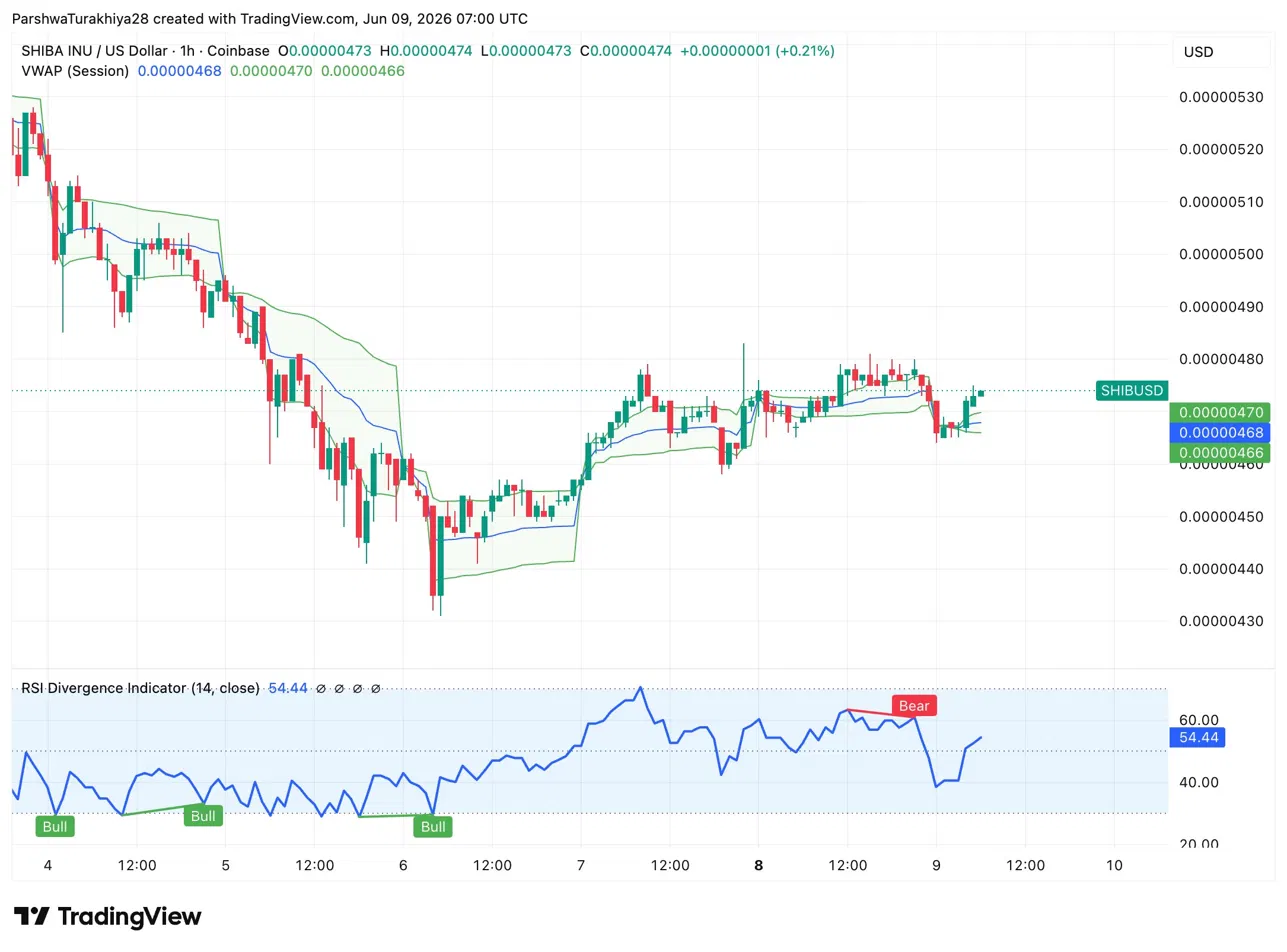
Price recovered from $0.00000430 and now holds above all three VWAP bands stacked between $0.00000466 and $0.00000470.
Three bullish RSI divergences between June 4 and June 6 powered the move up. RSI sits at 54.44 with a fresh bearish divergence printed near $0.00000480, which means the recovery is losing momentum right at a logical resistance area.
Shiba Inu Price Prediction for June 10, 2026
- Upside: A hold above $0.00000470 and a reclaim of $0.00000530 puts $0.00000560 in play. Sustained daily burn activity above 1M tokens adds weight to that scenario.
- Downside: A close below $0.00000460 reopens the path to $0.00000420, the triangle’s measured downside target.
Disclaimer: The information presented in this article is for informational and educational purposes only. The article does not constitute financial advice or advice of any kind. Coin Edition is not responsible for any losses incurred as a result of the utilization of content, products, or services mentioned. Readers are advised to exercise caution before taking any action related to the company.


 Price Prediction 2026, 2027, 2028, 2029, 2030-2050")

