


- US market cap to GDP hit record 238% with stocks worth $75.7T against a $31.8 T economy.
- Top 10 stocks now represent 41% of S&P 500, surpassing the 27% dot-com peak in 2000.
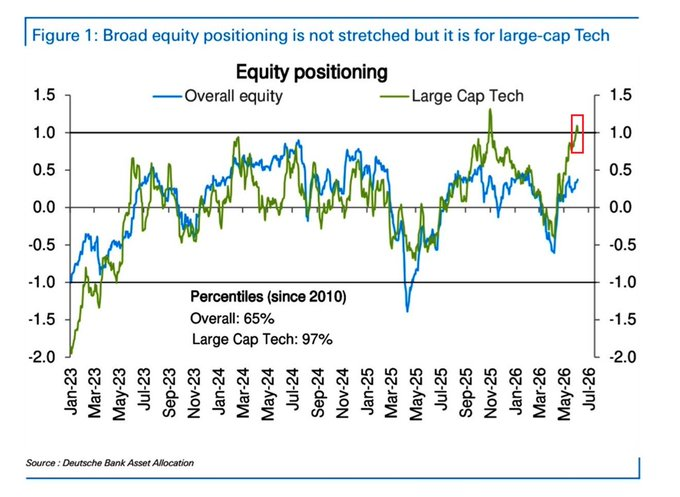
- Tech positioning hits the 97th percentile of 16 years, raising violent liquidation risk if yields rise.
The US stock market’s total value has surged to $75.7 trillion, pushing the market cap to GDP ratio to a record 238%. The entire US economy generates approximately $31.8 trillion in annual output. The stock market is now worth two and a half times that.
Context on how extreme this is:
- The ratio sits 90% points above the dot-com bubble peak of 148%
- Since 2008, the US stock market has grown at five times the rate of the underlying economy
- The ratio has surged 38% points since the S&P 500 bottomed on March 30
The S&P 500 Is No Longer What Most People Think It Is
The top 10 stocks now represent 41% of the entire S&P 500, a level never recorded in 145 years of market history. The previous record was 27% at the dot-com peak.
Beneath the headline gains, market performance has become heavily concentrated in AI stocks rather than broad-based across the index.
Since February 27, the S&P 500 has gained 7.34%, but excluding AI stocks leaves the index essentially flat (0%) over the same period.
The concentration is also evident during selloffs. When the S&P 500 fell 2.64% on Friday, the other 493 non-AI companies moved just 0.02%, indicating that the decline was largely driven by a simultaneous selloff in AI stocks.
Anyone buying an S&P 500 index fund today is not buying diversified exposure to 500 American companies. They are placing a concentrated bet on AI, whether they realize it or not.
The Positioning Problem
Investor positioning in large-cap tech has reached 1.0 points, higher than 97% of all readings over the past 16 years. This marks a sharp reversal from minus 0.4 points when the market bottomed in late March.
Analysts at Macro Alpha framed the risk, noting that when 97% of the market is positioned on the same side of the trade, the question becomes: who is left to buy? The answer is nobody.
At that level of concentration, any catalyst that forces selling does not produce an orderly rotation. It produces a liquidation.
The specific trigger analysts are watching:
- Real yields moving higher would immediately reprice long-duration AI stocks
- A cost-of-capital shock hits all these names simultaneously, not sequentially
- Smart money is described as quietly distributing to retail momentum buyers right now
The Historical Parallel
The dot-com comparison is unavoidable. In 2000, the top 10 stocks represented 27% of the S&P 500. What followed:
- The S&P 500 fell 50% over the following two years
- The Dow Jones, with less tech concentration, fell only 37% over the same period
The difference advocates cite is that today’s technology companies generate real revenue, unlike speculative dot-com businesses. The counterargument is that valuations already price in years of future growth.
Related: How SIREN Went From AI Memecoin to Boom-and-Bust
Disclaimer: The information presented in this article is for informational and educational purposes only. The article does not constitute financial advice or advice of any kind. Coin Edition is not responsible for any losses incurred as a result of the utilization of content, products, or services mentioned. Readers are advised to exercise caution before taking any action related to the company.


 Price Prediction 2026, 2027, 2028, 2029, 2030-2050")

