


- SOL’s bullish momentum remains strong amid market volatility.
- Traders should watch for potential corrections and profit-taking activity.
- Positive momentum is expected to continue for SOL with growing purchasing pressure.
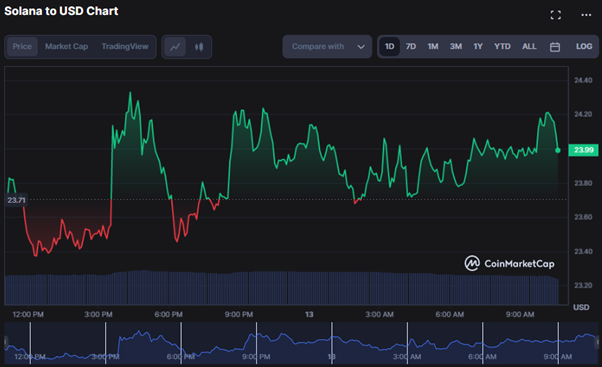
Solana (SOL) saw early-day volatility, with bears aiming to destabilize the market’s upward momentum. Due to these oscillations, the SOL price soared from a 24-hour low of $23.34 to an intra-month high of $24.34 in only a few hours. As of this writing, bullish control was still in power, with SOL trading at $24.15, up 1.87% from the previous day’s close.
Positive market mood and the strong investor buying pressure may push the SOL/USD market over the 30-day high, with traders targeting the next resistance levels at $25.00 and $26.00. However, traders should be wary of possible market corrections and profit-taking activity, which may result in minor price drops and volatility in the SOL/USD market, with support levels between $22.00 and $20.00.
The SOL market capitalization increased by 0.87% to $9,428,550,492, but the 24-hour trading volume decreased by 12.74% to $1,059,363,899. This movement might imply that investors are hoarding their SOL tokens rather than actively trading them.
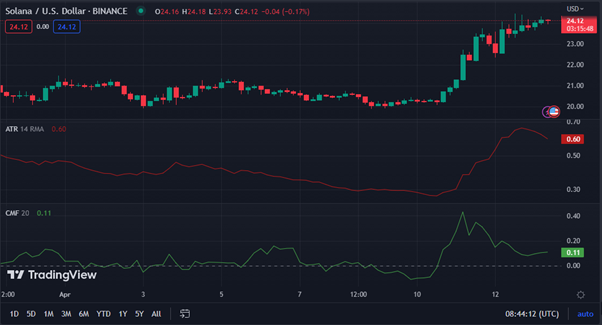
The SOL price chart’s Average True Range (ATR) value of 0.60 indicates that the bullish momentum is robust and volatile. This might be a buying opportunity, but traders should be wary of sharp price changes.
This expectation of additional gain stems from the fact that the ATR is still in positive territory, indicating that bullish momentum is still in the market. However, since the ATR is sloping downward, this might signal a reduction in volatility and the beginning of a consolidation period or a reversal in the prevailing trend.
The capital flow into SOL is marginally positive, with a Chaikin Money Flow score of 0.10, indicating that investors are buying despite the probable reduction in volatility suggested by the ATR going southward. If the CMF score continues to rise, it may imply more purchasing pressure and, as a result, a positive trend for SOL.
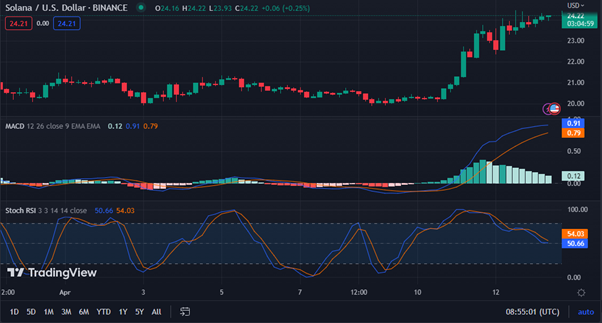
With a MACD reading of 0.90, positive momentum in SOL is expected to continue as it climbs above its signal line, which has a value of 0.78. This movement shows that the price of SOL will continue to rise, and traders may consider purchasing the asset since it represents a potentially rewarding opportunity.
The growing histogram green bars on the 4-hour price chart signal a rise in purchasing pressure, which supports the optimistic forecast for SOL’s price.
However, the stochastic RSI trending below its signal line with a reading of 48.26 shows that momentum may be slowing and that a short-term correction may occur before the positive trend restarts. This activity warns investors to constantly watch price movement and critical support levels to assess whether a trend reversal is approaching or merely a brief dip.
As SOL’s bullish momentum continues, investors should stay vigilant for possible corrections, but the positive trend remains promising for the token.
Disclaimer: The views, opinions, and information shared in this price prediction are published in good faith. Readers must do their research and due diligence. Any action taken by the reader is strictly at their own risk. Coin Edition and its affiliates will not be liable for direct or indirect damage or loss.
Disclaimer: The information presented in this article is for informational and educational purposes only. The article does not constitute financial advice or advice of any kind. Coin Edition is not responsible for any losses incurred as a result of the utilization of content, products, or services mentioned. Readers are advised to exercise caution before taking any action related to the company.

: What Happens If You Use an Unlicensed Platform?")


