


- Although SOL initially slid to a 7-day low, it recovered while ETH also followed.
- SOL exited the oversold region and is attempting to crossover to the bullish side.
- If the AO continues to push for a positive value, then ETH may form a bullish structure.
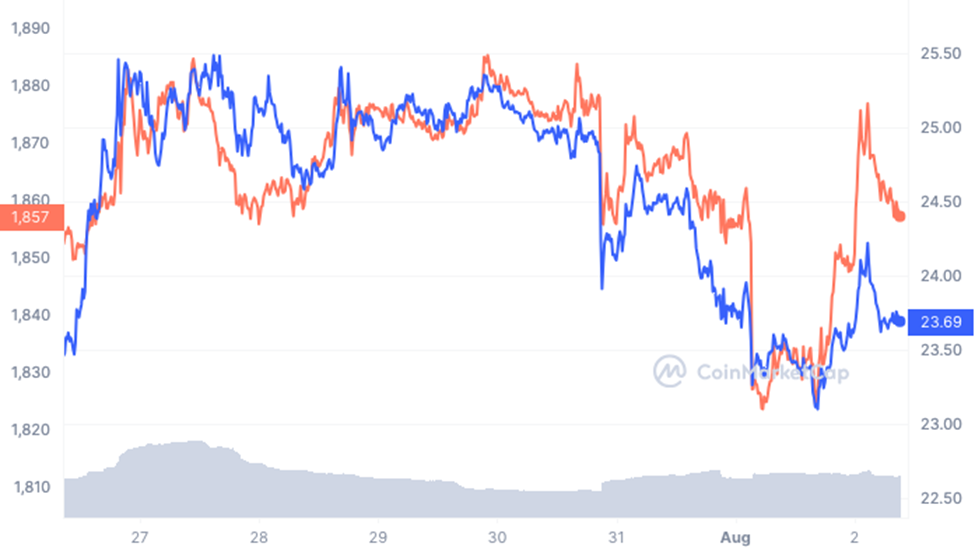
Despite recent talks of an altcoin season, assets like Solana (SOL), and top-ranked altcoin Ethereum (ETH) have not lived up to expectations. According to CoinMarketCap, SOL previously hit a 7-day low on August 1 before its 24-hour recovery to $23.70 at press time.
Like Solana, ETH also slipped for the third consecutive day, falling as low as $1,826 on the same day mentioned above. However, like two peas in a pod, ETH and SOL moved up the charts as the crypto market cap jumped to $1.18 trillion.
Solana (SOL)
SOL’s dip below $23 on August 1 represented its weakest fall since July 25. Although SOL rose high above $25.01 on July 30, the token has been subject to massive selling pressure. One of the stimulants of the plunge was the Relative Strength Index (RSI).
From the 4-hour chart, the RSI fell below the buying support on July 31 when it was around a value of 50. Furthermore, the selling pressure experienced ensured that the RSI reached 30.22. This placed SOL in the oversold area.
However, the index’s rise to 41.31 suggests that bearish momentum has not intensified. Subsequently, SOL may not fall below $20, and if accumulation supersedes distribution, the token may attempt to reach $25 again.
Also, traders may need to watch out for a confirmation from the Directional Movement Index (DMI). At the time of writing, the + (DMI) was 17.21, while the -DMI (red) was 27.19. This indicates that, despite slightly increasing demand, sellers’ presence has not been neutralized.
Additionally, the Average Directional Index (ADX) was 29.35, meaning there was a strong directional movement for the -DMI. But if the RSI approaches 50, and the +DMI continues to rise, then bears’ dominance could falter.
Ethereum (ETH)
ETH was another altcoin that retreated before a strong demand at $1,825 pushed the price to $1,873 in the later hours of August 1. However, some profit-taking from the slight gains sent the price back to $1,854.
But the Awesome Oscillator (AO) was -5.49— a notable increase from -27.71. The increase in the AO suggests that bullish forces were attempting to drive the market. If the indicator continues to exit the negative area or hits the zero-mid point, then ETH’s momentum could favor buyers.
In the event of a breakout, ETH might move closer to $2,000. Alternatively, SOL could exchange hands between $23 to $25 depending on the buying pressure.
Disclaimer: The views, opinions, and information shared in this price prediction are published in good faith. Readers must do their research and due diligence. Any action taken by the reader is strictly at their own risk. Coin Edition and its affiliates will not be liable for direct or indirect damage or loss.
Disclaimer: The information presented in this article is for informational and educational purposes only. The article does not constitute financial advice or advice of any kind. Coin Edition is not responsible for any losses incurred as a result of the utilization of content, products, or services mentioned. Readers are advised to exercise caution before taking any action related to the company.


