


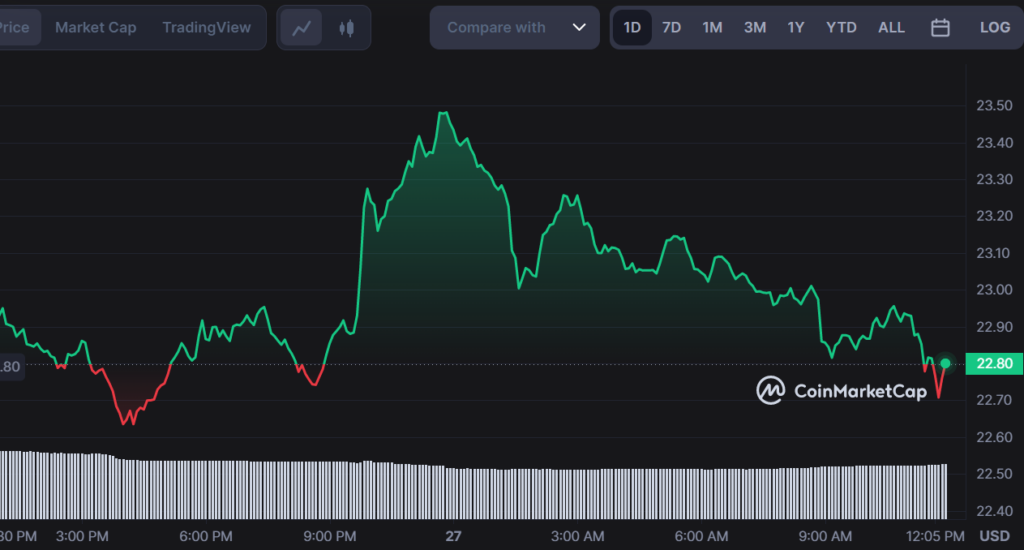
- Solana price analysis is bearish, forming lower lows at $22.63.
- The token’s price has sought support at around $20.00.
- A break below the neckline of the head-and-shoulders pattern could see SOL/USD fall to $20.00.
Solana price analysis for today shows SOL is trading a declining trendline after failing to break above the $26 barrier. In the short term, the cryptocurrency is seen trading over a head-and-shoulders pattern with a neckline at $22.00.
The bearish sentiment has been consistent in recent months as SOL/USD continues to test lower lows below the $22 region. A breakout of this pattern would likely result in further losses toward the $20.00 support level.
The Relative Strength Index (RSI) is still declining, signaling that bears are in control of the short-term momentum. If the RSI remains below 50, then Solana could extend its losses further toward the $18 support barrier. On the other hand, if bulls manage to regain control, then Solana could retest the $26 resistance level.
Looking at the larger picture, Solana has formed a falling wedge pattern. This is a bullish sign and could suggest that SOL/USD will eventually break out to the upside. However, this could take some time as traders wait for confirmation of a trend reversal before entering the market.
Solana price analysis on the 4-hour chart shows Solana has been trading in a sideways channel over the past few days. The MACD has also crossed into bearish territory, indicating that selling pressure could be increasing.
The moving averages are also trending lower, suggesting that the bearish momentum is likely to remain in control over the short term. The SMA 20 has crossed below the SMA 50, further confirming that bears are in control of the sentiment.
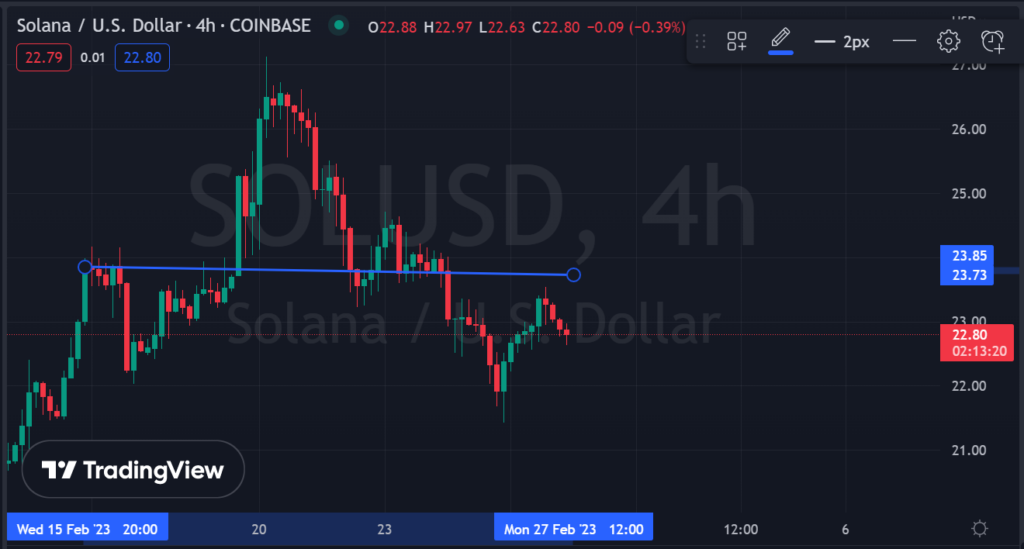
Solana’s price has sought support at the Fibonacci level of $20.00 and could find it difficult to break below this level over the coming days. If bulls push back against the bearish pressure, then Solana could rise toward $22.00 and attempt to break out of its falling wedge pattern.
In conclusion, Solana’s (SOL) price analysis is bearish with a head-and-shoulders pattern. If the neckline breaks below $22, then SOL/USD will likely fall to the $20 support level. However, bulls could cause a pullback above the $26 resistance if they regain control of the price. In any case, traders should remain patient and wait for a clear trend reversal before entering the market.
Disclaimer: The views and opinions, as well as all the information shared in this price prediction, are published in good faith. Readers must do their research and due diligence. Any action taken by the reader is strictly at their own risk. Coin Edition and its affiliates will not be held liable for any direct or indirect damage or loss.
Disclaimer: The information presented in this article is for informational and educational purposes only. The article does not constitute financial advice or advice of any kind. Coin Edition is not responsible for any losses incurred as a result of the utilization of content, products, or services mentioned. Readers are advised to exercise caution before taking any action related to the company.
 Price Prediction: Can BTW Sustain Its Breakout Above $0.1032?")


