


- Bear momentum in SOL is invalidated by bulls as the price rises to $16.62 a 4.14%
- Traders should exercise caution in the near future, according to technical indicators
- Market excitement in SOL surges, leading market capitalization to rise
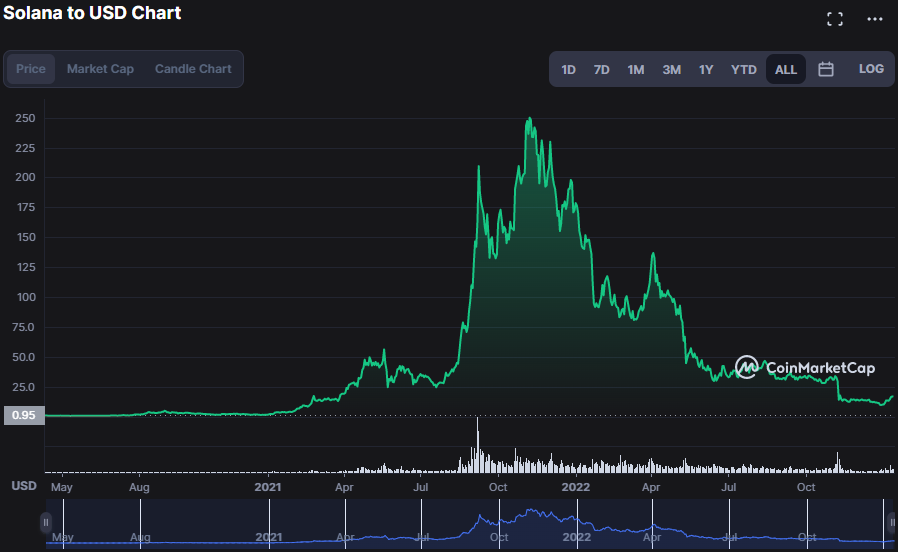
Solana (SOL) dropped 93.49% from its all-time high of $260.06 by 2023. After the FTX crisis, SOL lost roughly 60% of its value overnight. Some hopefully waited for SOL to gain New Year’s buyer momentum and help them recoup some of their losses.
Despite this decline, recent Solana ecosystem advancements seem to have buoyed traders. Bonk Inu (BONK), a dog-themed meme currency on the Solana blockchain network, has been performing well in the crypto market. Since its introduction on January 3, 2023, SOL’s market capitalization rose 3.55% to $6,166,343,155 and 24-hour trading volume rose 28.49% to $956,481,023, reflecting on the growing market interest.
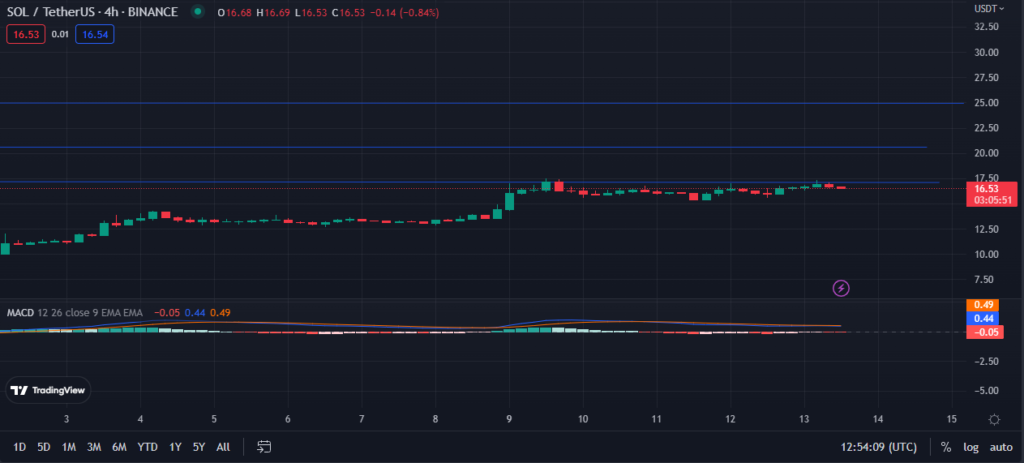
If the bullish surge in the SOL market continues, the $17.36 resistance level (highest in the previous 30 days) will be breached. This enthusiasm may accelerate the price to a new level, causing a domino effect in the market and leading to an exponential rise in the price of SOL.
If the price breaks through the present resistance level of $17.36 and continues to increase with the same velocity as in previous days, the next resistance levels may be located around $20.63, $25.00, and $27.75, respectively. However, if bullish force fades and the $17.36 resistance level is not achieved, bears may recover momentum and the price may go back to lower levels.
However, the MACD blue line’s dip below the signal line at 0.45 casts doubt on the bullish eruption. Adding fuel to the fire of this pessimistic foreboding is the downward trend of the histogram.
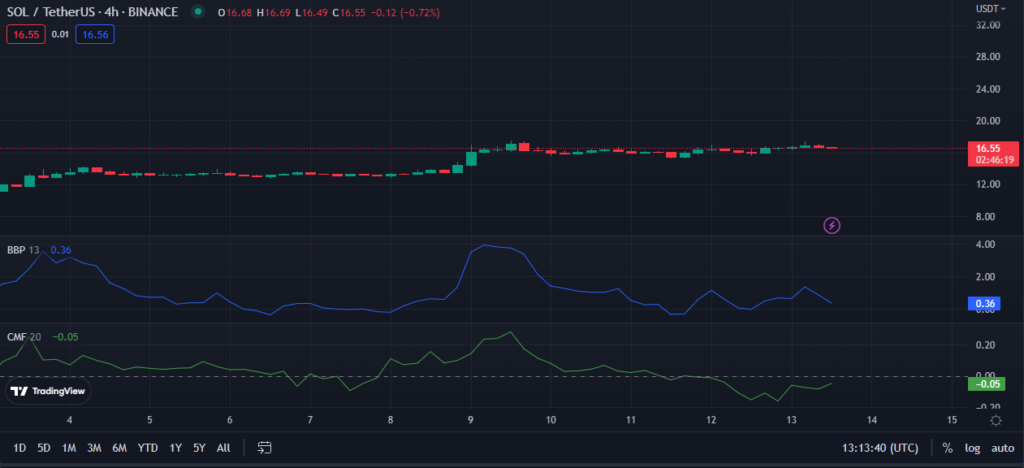
The Bull Bear Power (BBP) heading south with a value of 0.36 warns traders that a probable reversal is coming. This movement shows that the purchasing pressure that is pushing the price higher is waning, and that a trend reversal is probable.
Investors in the SOL market should be cautious since the Chaikin Money Flow indicator, at -0.05, shows that the market is projected to fall in the near future. However, the fact that it is trending higher suggests that there is optimism for the market, as investors continue to pump money into it.
Despite the market’s current upward direction, the Solana (SOL) price chart shows that bull momentum is waning.
Disclaimer: The views and opinions, as well as all the information shared in this price analysis, are published in good faith. Readers must do their own research and due diligence. Any action taken by the reader is strictly at their own risk, Coin Edition and its affiliates will not be held liable for any direct or indirect damage or loss.
Disclaimer: The information presented in this article is for informational and educational purposes only. The article does not constitute financial advice or advice of any kind. Coin Edition is not responsible for any losses incurred as a result of the utilization of content, products, or services mentioned. Readers are advised to exercise caution before taking any action related to the company.


