
- Solana reclaims key EMAs, but the 100-day EMA remains the next major resistance.
- Open interest stabilizes near $4.95B, reflecting healthier derivatives positioning.
- Balanced exchange flows show investors await a stronger catalyst before acting.
Solana (SOL) has started the week on firmer footing after recovering from its recent swing low, encouraging traders who have waited for signs of renewed strength. The token now trades near $78, reflecting improving short-term momentum after reclaiming key moving averages. Even so, the broader trend still demands caution because SOL remains below several important technical barriers.
Solana Builds Momentum but Faces Major Technical Barriers
SOL currently trades around $78.48 after climbing back above both the 20-day and 50-day exponential moving averages, which sit near $76.75. This recovery signals that buyers have regained some control following the recent decline.
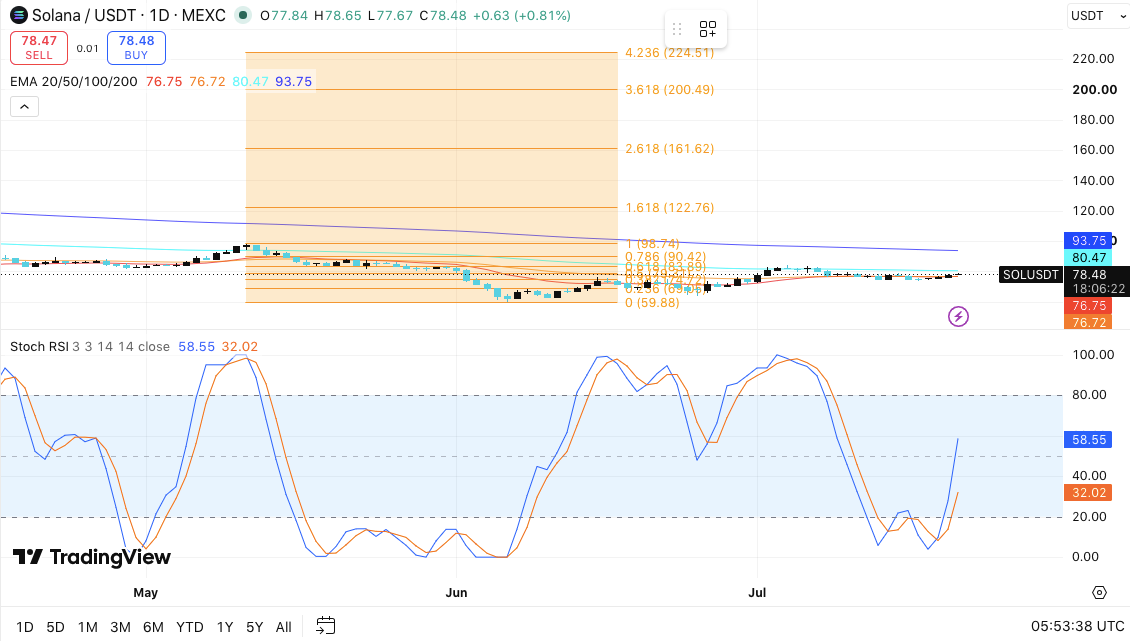
However, stronger resistance still lies ahead. The 100-day EMA at $80.47 remains the first major hurdle. Beyond that, the Fibonacci retracement levels at $83.89 and $90.42 could slow further gains. The 200-day EMA at $93.75 continues to represent the most important trend reversal level.
Additionally, the Stochastic RSI has turned higher after emerging from oversold conditions. That bullish crossover suggests buying momentum continues to improve. Nevertheless, traders will likely seek stronger trading volume before confirming a sustained breakout.
If SOL clears the $80.47 barrier, buyers could target $83.89 before attempting another advance toward $90.42. A successful move above the 200-day EMA would strengthen the longer-term bullish outlook and increase the possibility of testing the $98.74 Fibonacci extension.
Related: Chainlink Price Prediction: Can $1B United Stables Adoption Push LINK to $10?
Conversely, failure to defend the $76.70 support area could expose the token to declines toward $74.76. Additional weakness might send prices back to $69.79 or even the recent swing low near $64.79.
Derivatives Activity Signals Balanced Market Conditions
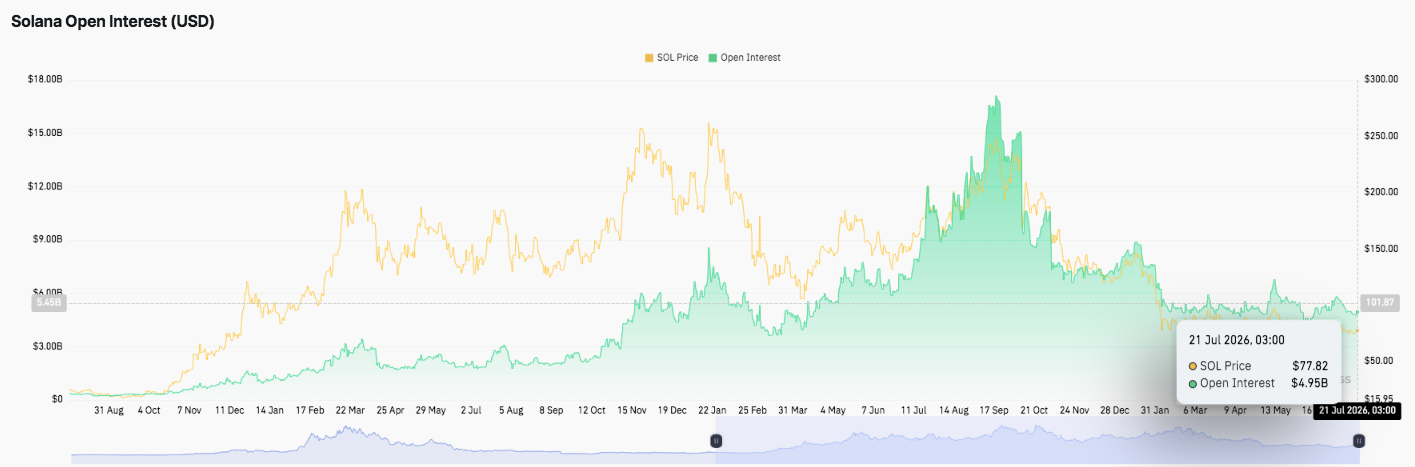
Open interest has followed Solana’s price cycles throughout recent months. During the previous rally, leveraged positions expanded rapidly and pushed total open interest above $16 billion.
That optimism faded as the market corrected. Traders unwound positions, causing open interest to fall sharply alongside declining prices.
More recently, the metric has stabilized near $4.95 billion while SOL trades close to current levels. Consequently, speculative leverage has eased, leaving the derivatives market in a healthier position. A steady rise in both price and open interest would likely indicate fresh capital entering bullish positions. On the other hand, falling open interest could reflect weakening participation.
Exchange Flows Suggest Investors Await a Stronger Catalyst
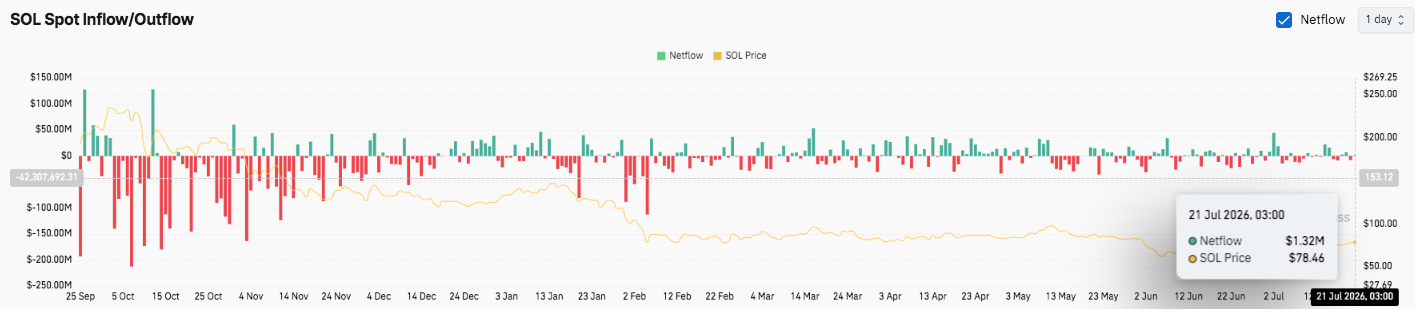
Spot exchange flows also reveal changing investor behavior. Earlier periods featured heavy net outflows, with several daily withdrawals exceeding $200 million. Those movements often indicated investors accumulated SOL and transferred holdings away from exchanges.
Recently, exchange activity has become far more balanced. The latest data recorded a modest net inflow of about $1.32 million, suggesting neither buyers nor sellers currently dominate market sentiment.
Technical Outlook for Solana Price
Key technical levels remain in focus as Solana attempts to build on its recent recovery while confronting major resistance.
Upside levels: $80.47 (100-day EMA), followed by $83.89 (0.618 Fibonacci retracement) and $90.42 (0.786 Fibonacci retracement). A decisive breakout above the $93.75 200-day EMA could pave the way for a rally toward $98.74.
Downside levels: The $76.72–$76.75 area, marked by the 20-day and 50-day EMAs, serves as immediate support. Below that, $74.76 and $69.79 represent the next key downside levels, while $64.79 remains the critical swing low that bulls must defend.
Resistance ceiling: The 200-day EMA at $93.75 remains the most important level for confirming a medium-term bullish reversal.
The technical structure continues to improve as SOL forms higher lows and reclaims its short-term moving averages. Meanwhile, the Stochastic RSI has turned higher, signaling strengthening momentum. However, the price still trades below the major long-term resistance zone, leaving the broader trend neutral until buyers reclaim higher levels.
Will Solana Go Up?
Solana’s near-term outlook depends on whether buyers can sustain the recovery above the $76.72–$76.75 support zone and push through the $80.47 resistance. A successful breakout could attract fresh buying interest and drive the price toward $83.89, $90.42, and eventually the 200-day EMA at $93.75.
Additionally, stable open interest and relatively balanced exchange flows suggest leverage has normalized, leaving room for a stronger directional move once market conviction returns.
Related: Pump.fun (PUMP) Price Prediction 2026, 2027, 2028, 2029, 2030-2050
However, failure to hold current support could shift momentum back to the bears, exposing SOL to $74.76, $69.79, and potentially the $64.79 swing low. For now, Solana remains at a critical technical crossroads where price action around the $80–$94 resistance zone will likely determine the next major trend.
Disclaimer: The information presented in this article is for informational and educational purposes only. The article does not constitute financial advice or advice of any kind. Coin Edition is not responsible for any losses incurred as a result of the utilization of content, products, or services mentioned. Readers are advised to exercise caution before taking any action related to the company.