


- An analyst predicted that Solana could swing upwards due to a signal from the TD Sequential.
- SOL’s price could increase by 12% revisiting the highs it last reached on February 18.
- The MACD revealed that the bullish thesis had not yet been validated but was close.
If the prediction by analyst Ali Martinez is anything to go by, then Solana’s (SOL) price could be set for a rebound. Martinez, in a post on X, noted that the Tom DeMark (TD) Sequential had presented a buy signal on the SOL/USDT daily chart.
The analyst also mentioned that this signal could create four bullish candles on the chart while driving an upswing for the token.
Are Bears Exhausted?
The TD Sequential indicates trend exhaustion and potential price reversals. From the chart Martinez attached to his post, sellers seem to have been exhausted around $99. This created a bullish reversal as Solana’s price climbed above $103.
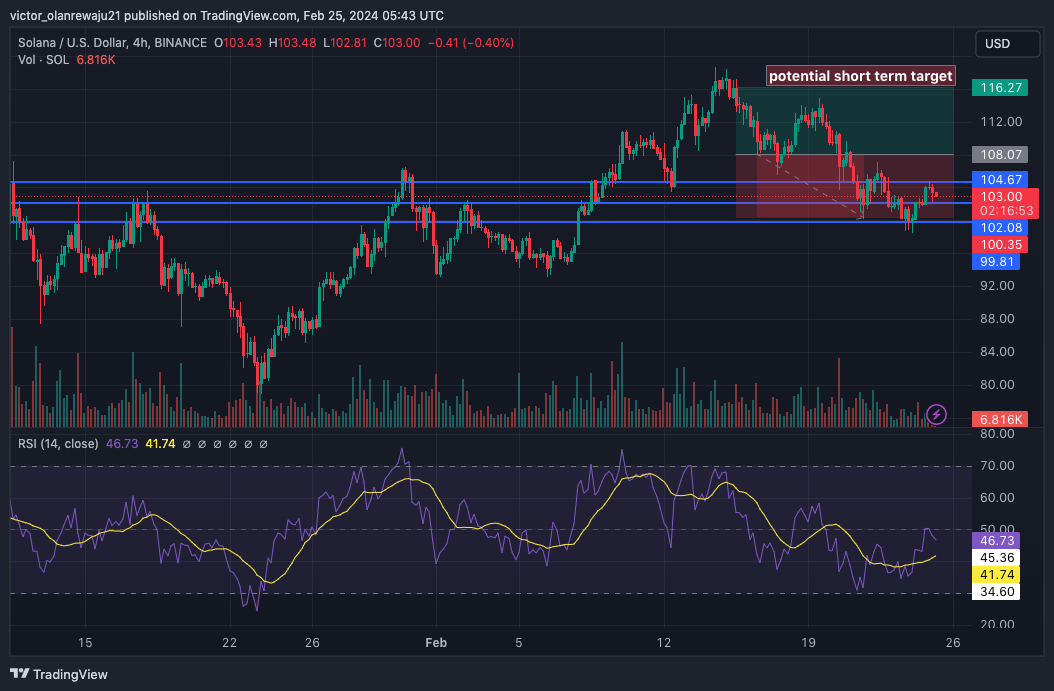
SOL has lost 5.88% of its value in the last seven days, according to CoinMarketCap data. A look at the chart on the 4-hour timeframe revealed that the altcoin had tried to ascend to $105. However, a resistance appeared at $104.67 and pulled the price back down.
If bulls can defend the support at $102.08, then SOL might bounce higher than $105 with intense buying pressure. On the other hand, failure to defend the area could see SOL retrace to $99.81.
Coin Edition looked at the Relative Strength Index (RSI) and noticed that the reading had dropped below the 50.00 midpoint. This reading reinforced the notion that bears have tugged back the price.
However, increased buying pressure could force sellers out of the way. Should this be the case, SOL could beat the $108.07 resistance. If SOL flips the aforementioned resistance, the price could increase by almost 12% from the press time value of $103. In this case, the altcoin could be trading around $116.27.
Capital Begins tao Flow Slowly
Regardless of the potential upswing, traders might need to watch out for enhanced bearish momentum. Should bears win over bulls, SOL could slide below $100 one more time.
Furthermore, the Moving Average Convergence Divergence (MACD) was in the positive region. Typically, this suggests a bullish momentum. However, 12 EMA (blue) and 26 EMA (orange) were in the negative region, indicating that the bullish thesis had not yet been validated.
But the 12 EMA crossing over the 26 EMA indicated that buyers were outpacing sellers. If the EMA crosses the signal line, then SOL’s potential rise to $116.27 might be a done deal.
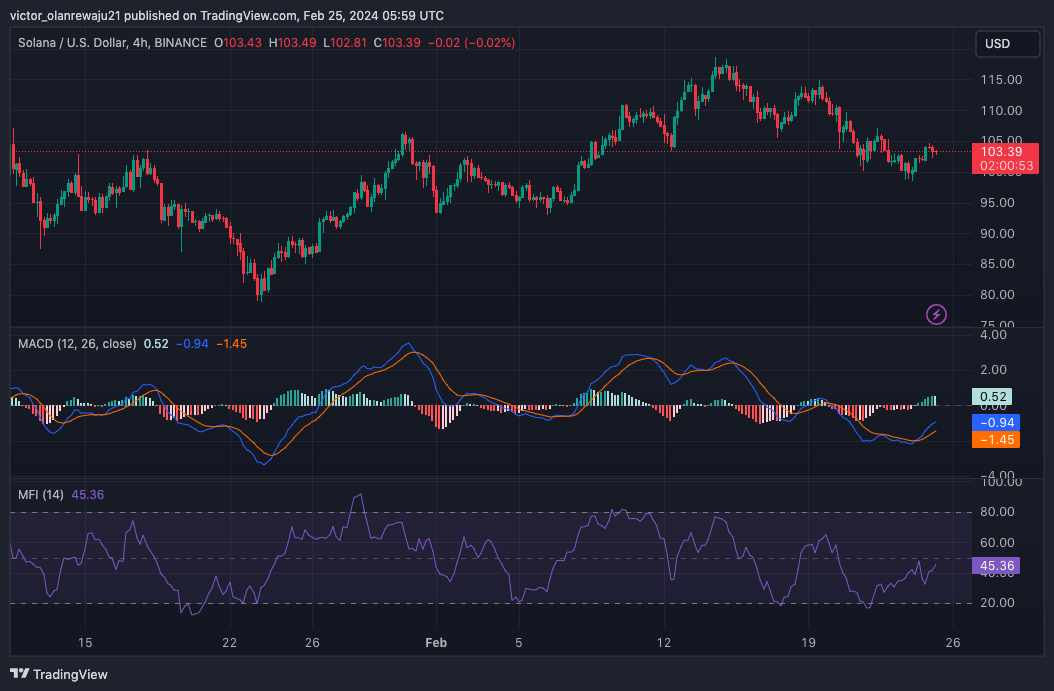
In addition, the Money Flow Index (MFI) revealed that capital, although still minimal had begun to flow into SOL. If the MFI reading rises toward 62.82, SOL’s price could inch toward $120. If not, the altcoin might keep consolidating between $102 and $108. But in the meantime, a bounce in the northward direction looks likely.
Disclaimer: The information presented in this article is for informational and educational purposes only. The article does not constitute financial advice or advice of any kind. Coin Edition is not responsible for any losses incurred as a result of the utilization of content, products, or services mentioned. Readers are advised to exercise caution before taking any action related to the company.
Disclaimer: The information presented in this article is for informational and educational purposes only. The article does not constitute financial advice or advice of any kind. Coin Edition is not responsible for any losses incurred as a result of the utilization of content, products, or services mentioned. Readers are advised to exercise caution before taking any action related to the company.


