


 Erases Gains, Forces $12 Million Liquidations")
- Following the confirmation of an untrue XRP development, the SOL price fell to $54.
- Long positions worth almost $5 million were liquidated as Open Interest dropped.
- The SOL price may fall to $50 but a recovery may be forthcoming in a short while.
Traders who opened several Solana (SOL) futures positions with the hope of making profits from the price movement were hit with a surprise on November 13. This was because the SOL price, which has solidly moved in the upward direction for weeks, suddenly tumbled.
According to CoinMarketCap, SOL’s price was $54.66 at press time. This value constitutes a 6.37% decrease in the last 24 hours. For many participants in the crypto market, the plunge was caused by the news that the initial Ripple (XRP) ETF appearance was a rumor.
SOL Follows BTC and ETH
Not only did XRP and SOL feel the heat, but Bitcoin (BTC) and Ethereum (ETH) were also affected. Based on Coinglass data, BTC and ETH had the highest amount of liquidations in the last 24 hours.
But following them closely behind was SOL which forced a $12.64 million wipeout within the same period.
A close look at the derivative information portal showed that SOL longs were the most affected with the liquidation amounting to $8.74 million. Shorts, on the other hand, experienced a little over half of the long liquidations.
One of the reasons why SOL was part of the top three wipeouts was because of its price action over the last three months. Within the last 90 days, SOL’s value has increased by 131.98%. So, it was almost unavoidable for market players not to try and capitalize on the token’s bullish trend.
Open Interest Falls
As a result of the uncertainty driven by the plunge, Open Interest around the Solana token dropped by 11%. Open Interest is the number of outstanding contracts in the market. When the Open Interest increases, it means a surge in interest in trading a token accompanied by an increase in open positions.
However, a decrease implies that traders are increasingly closing their positions. Sometimes, this closure could be due to profit-taking or like SOL’s case, a change in market sentiment and direction.
Declining Open Interest on falling price is a bearish sign. So, SOL may drop from $54. This was also evident in the Moving Average Convergence Divergence (MACD). At press time, the MACD was -1.023, indicating dwindling buying movement.
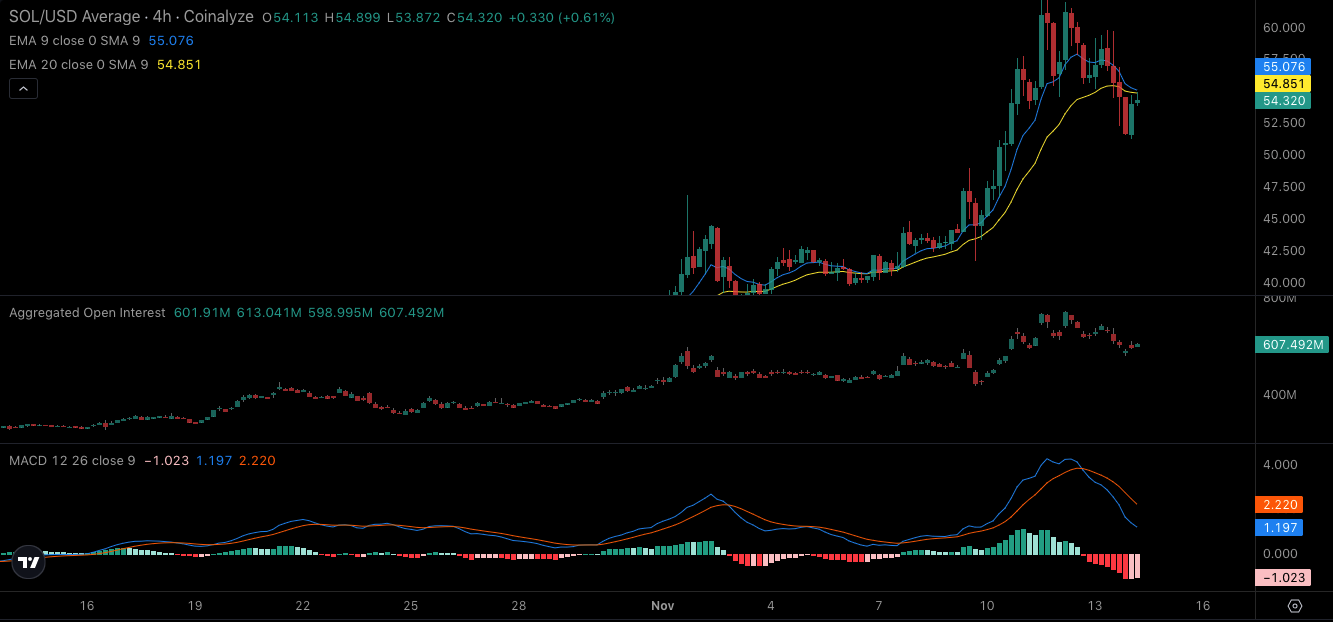
Also, the 12 to 26 close with the orange line above the blue suggests that sellers are currently in control. However, from the chart above, SOL has a chance to recover in the short term. This is because the 9-day EMA (blue) had maintained its crossover above the 20-day EMA (yellow).
Typically, this position is termed bullish. Therefore, it is likely that SOL falls to around $52 to $50. But with reappearing buying pressure, it could only be a matter of time before it reclaims $60.
Disclaimer: The information presented in this article is for informational and educational purposes only. The article does not constitute financial advice or advice of any kind. Coin Edition is not responsible for any losses incurred as a result of the utilization of content, products, or services mentioned. Readers are advised to exercise caution before taking any action related to the company.


 Price Prediction 2026, 2027, 2028, 2029, 2030-2050")

