


- XRP dropped to $0.65 as selling momentum began to outweigh buying pressure.
- Exchange inflow increased while OBV fell, suggesting a drawdown to $0.60
- Traders should be wary of opening long positions considering the current profit-taking in the market.
At the expense of its holders, the price of Ripple (XRP) has dropped to $0.65. This decrease represents a 9.72% fall in the last seven days, considering that the token hit $0.72 on November 7. The recent price action is in line with the cooling period a lot of altcoins are having.
From the XRP/USD 4-hour chart, there has been a surge in profit-taking as the price fell from $0.67 on November 12. Also, the bulls have been unable to defend the $0.66 support level. One of the reasons for this decline could be linked to the decreasing interest in XRP, as indicated by the trading volume.
So, traders may need to refrain from opening long positions because a decreasing volume, alongside a falling price, is an indication that XRP may not have hit a local bottom yet. Furthermore, the Relative Strength Index (RSI) had fallen below the 50.00 midpoint.
Buyers Look the Other Way
The RSI reading here indicates that the buying momentum was subsiding. If sellers continue to determine the market direction, then XRP could drop to $0.60. Like the RSI, the On Balance Volume (OBV) also decreased.
The OBV shows the intent of market players by measuring the buying and selling volume. A rising OBV suggests an increase in buying pressure. On the other hand, a drop in the OBV indicates a rise in the sell orders.
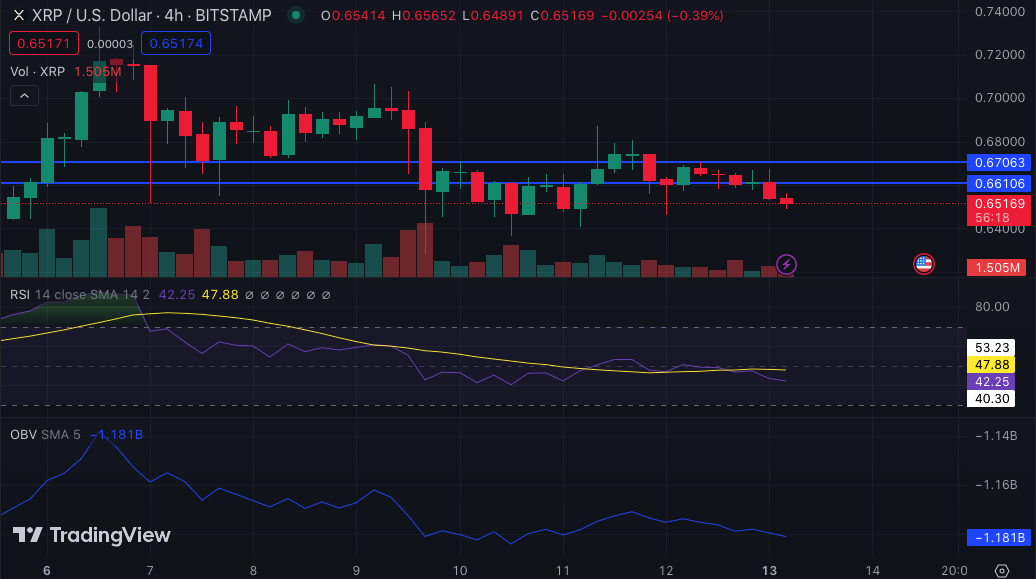
Should the OBV fail to head in the accumulation direction, then the projection to $0.60 may be confirmed. Another reason why XRP gains may continue to shred is because of the exchange inflow.
Typically, a surge in the exchange inflow suggests that market participants are willing to sell. This, could, in turn, lead to a price correction. Interestingly, a large number of XRP were sent into the Bitstamp exchange on November 12, based on information from Whale Alert.
XRP Faces Further Correction
Besides the whale data, Coin Edition took another look at the technical perspective. One indicator that was examined is the Rate Of Change (ROC). The ROC is a momentum oscillator that compares the high and low of a cryptocurrency’s price during a trading period.
At the time of writing, the ROC was down to -2.94, suggesting a bearish momentum for XRP. The Moving Average Convergence Divergence (MACD) also confirmed the downward momentum as it dropped below the zero-mid point.
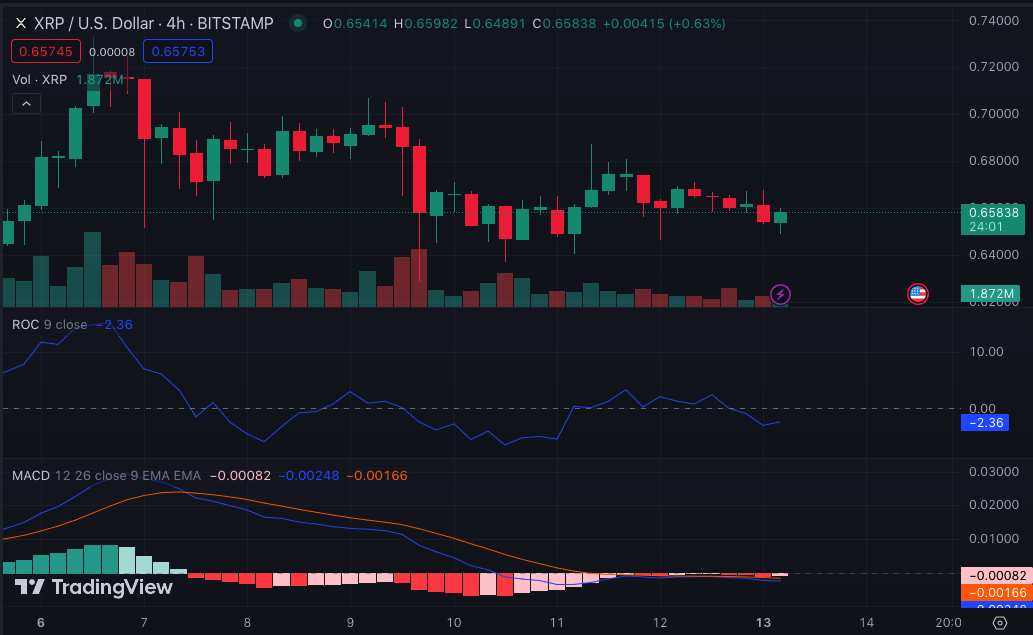
As it stands, XRP may find it hard to move in the upward direction over the next few days. Therefore, buyers planning to capitalize on a price increase may need to be cautious.
Disclaimer: The information presented in this article is for informational and educational purposes only. The article does not constitute financial advice or advice of any kind. Coin Edition is not responsible for any losses incurred as a result of the utilization of content, products, or services mentioned. Readers are advised to exercise caution before taking any action related to the company.


 Price Prediction 2026, 2027, 2028, 2029, 2030-2050")

