


 Price Analysis: How Feasible Is the Rise to $39?")
- With increasing strength, SOL may hit $39, according to Michaël van de Poppe.
- A correction to $26 is likely as indicated by the MFI and AO.
- If SOL support holds at $30.94, a jump toward $40 could be possible.
Crypto analyst Michaël van de Poppe told his 669,400 X (formerly Twitter) that they should not be astonished if Solana (SOL) rises to $36 or as high as $39. According to van de Poppe, who is also the founder of MN Trading, SOL has shown solid strength in the past few weeks.
He also mentioned that the token’s strength would not wane anytime soon. Previously, Coin Edition had reported on Solana’s mind-blowing performance, which made it the best-performing asset out of the top 10.
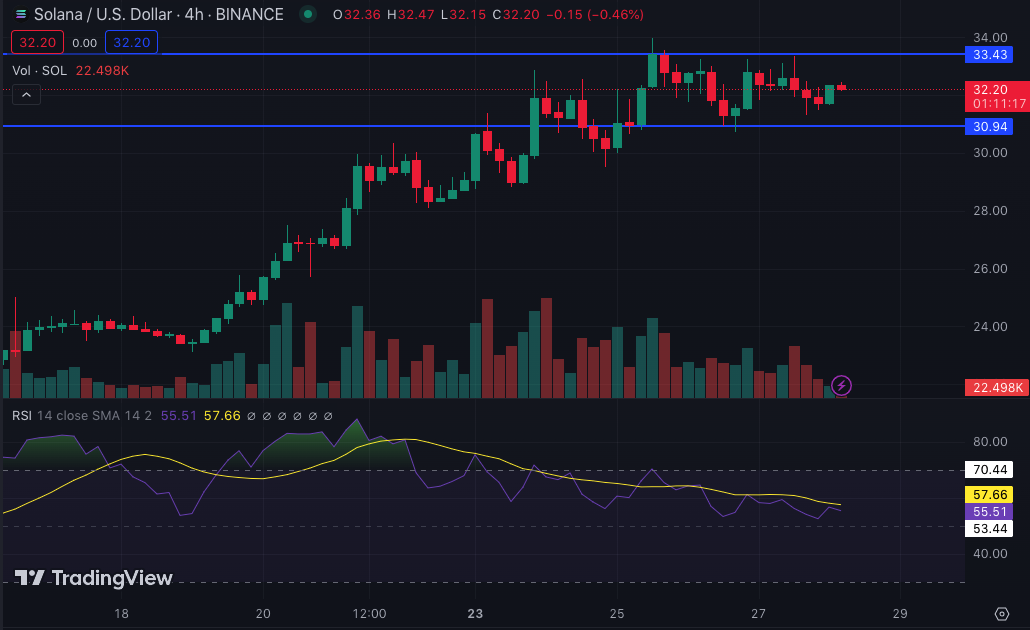
However, van de Poppe mentioned that there could be a correction for SOL that leads the token between $26 and $28. As per the 4-hour SOL/USD chart, the previously, largely bullish market structure has been marred with some profit-taking. This action has pushed the SOL price down to $32.23.
A Support At $30.94 Already
Also, there were attempts to drive the token to $35. But bulls met resistance at $33.43. Despite the sell-offs, SOL seemed to have strong support at $30.94. If by chance, the value drops to $28, a slight buying pressure could be sufficient to send SOL back into the $30 to $35 region.
With regards to the possible rise to $39, the Relative Strength Index (RSI) may need to change its trend. At press time, the RSI reading was 55.5. The indicator decrease was necessary especially as SOL hit an overbought point recently.
Also, the RSI reading means buying pressure had decreased. So, for SOL to rise as high as $39, buyers need to bring their A-game back into the market. Should the indicator rise to 65.00, then a first target of $35 may be plausible.
SOL Liquidity falls
Another indicator supporting a correction as mentioned by van de Poppe is the Money Flow Index (MFI). This indicator measures the flow of liquidity in and out of an asset within a specific period.
At the time of writing, the MFI had fallen to 37.14. This drop means selling pressure has outweighed buying pressure. Should the indicator drop below a reading of 30, SOL’s price may decrease to $28.
However, there is a likelihood of the MFI rising back above 50.00 if buying pressure resumes. In this case, SOL may approach $35 and possibly move as high as $40. But for now, further correction is the likely case for SOL as indicated by the Awesome Oscillator (AO).
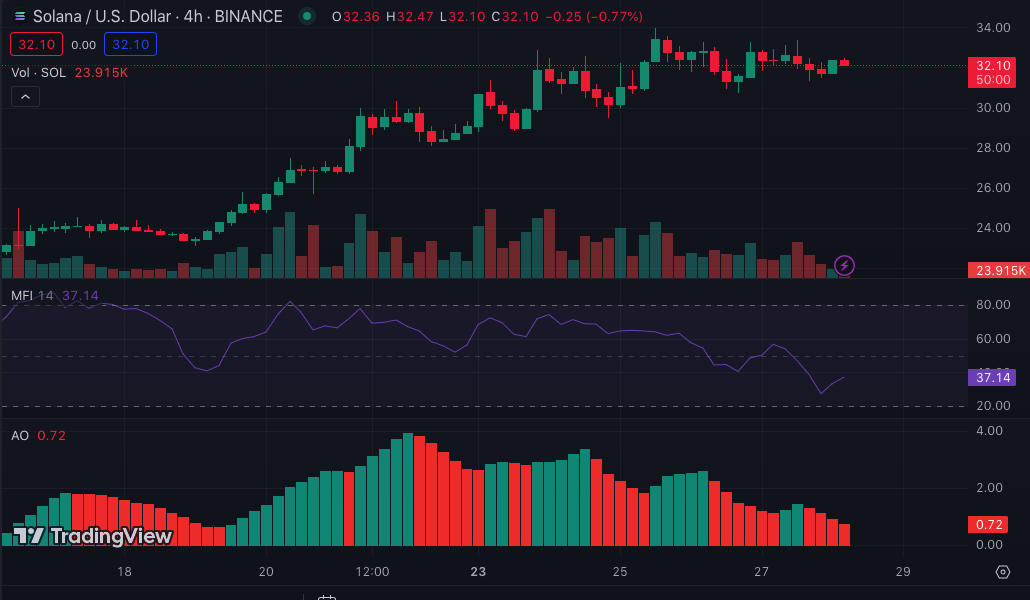
With the AO decreasing, it is not out of place to conclude that bearish forces are currently driving the market.
Disclaimer: The information presented in this article is for informational and educational purposes only. The article does not constitute financial advice or advice of any kind. Coin Edition is not responsible for any losses incurred as a result of the utilization of content, products, or services mentioned. Readers are advised to exercise caution before taking any action related to the company.


