


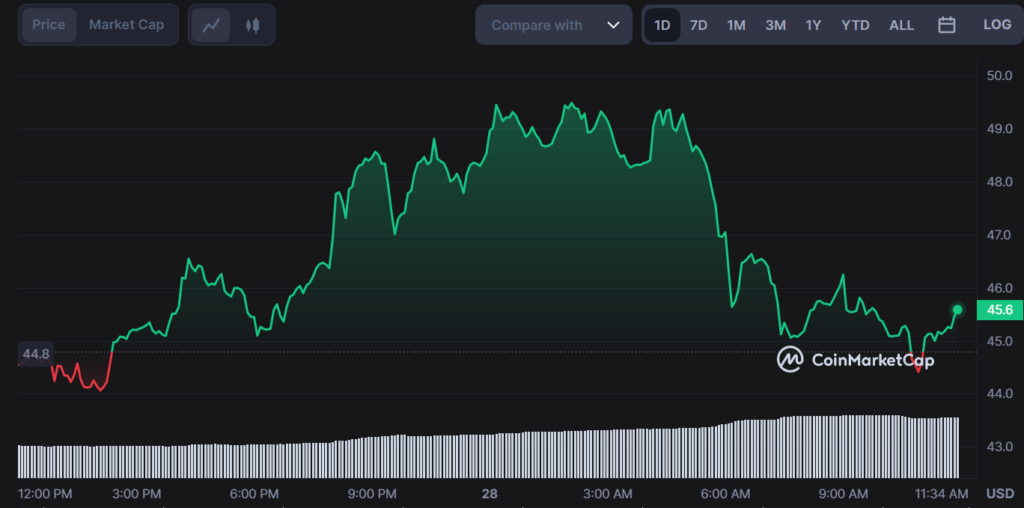
- SSV network has been trading within a range between $45.0 and $55.50 over the weekend.
- Prices have suddenly taken a plunge towards $45.0 where they are currently consolidating.
- A strong support level is seen at $45.0 and should SSV hold above this level, it could be poised for a rebound.
SSV token’s movement in the last 24 hours indicates the altcoin has formed higher highs at $50.050 from the previous low of $47.339. Bulls have been attempting to recover above $50.0 as the market faces a key resistance level at $55.50 which appears to be acting as the key barrier to break.
As of now, SSV is up by 0.69%, trading at $45.19 and the buyers are attempting to make a break above $50.0, and may be head higher.
If SSV falls, further losses can be expected in the near term with a possible target of $42.50 being established. A break above $50.0 will indicate that bulls still have enough strength to push prices higher and possibly test the resistance at $55.50 once again.
SSV’s trading volume has increased by over 87% as investors remain cautiously optimistic regarding the altcoin’s future performance. With prices trading sideways over the past few days, there could be a potential breakout in either direction depending on market sentiment.
Looking at the 1-day price chart, SSV has been trading in a slow but steady uptrend since opening the daily charts at an intra-day low of $39.81. From there, SSV has made its way up to a high of $50.05 today with the support at $45.0 allowing for some stability before prices can attempt a break above the resistance level at $55.50 once again.
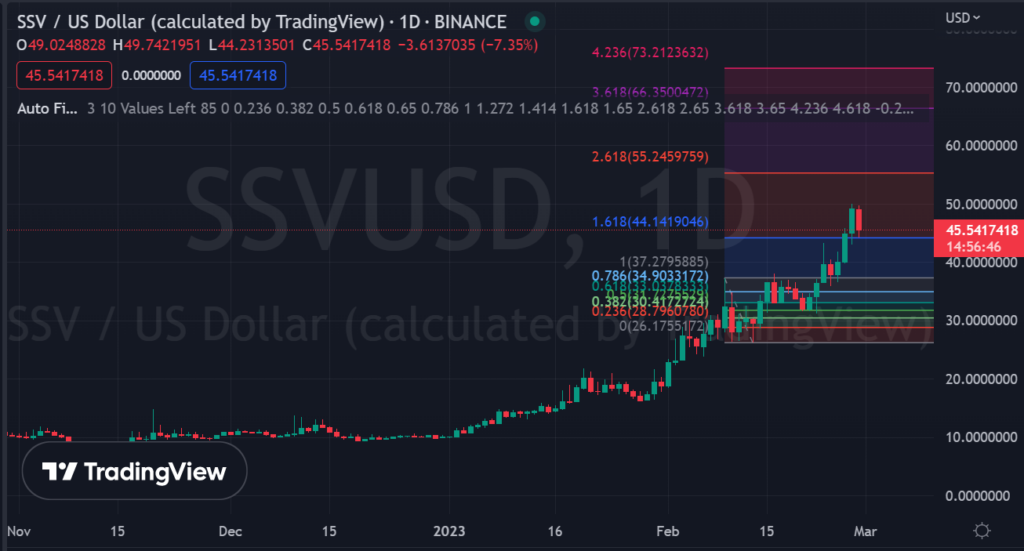
Looking at the technical analysis, the Fibonacci retracement levels suggest that SSV could be headed towards the 0.382 Fib level at $43.15 before attempting to rebound higher once again.
In conclusion, SSV has been trading sideways within a range between $45.0 and $55.50 over the past few days as buyers attempt to break through resistance. If bulls are unable to break above $50.0, further losses could be expected and a target of $42.50 seems likely.
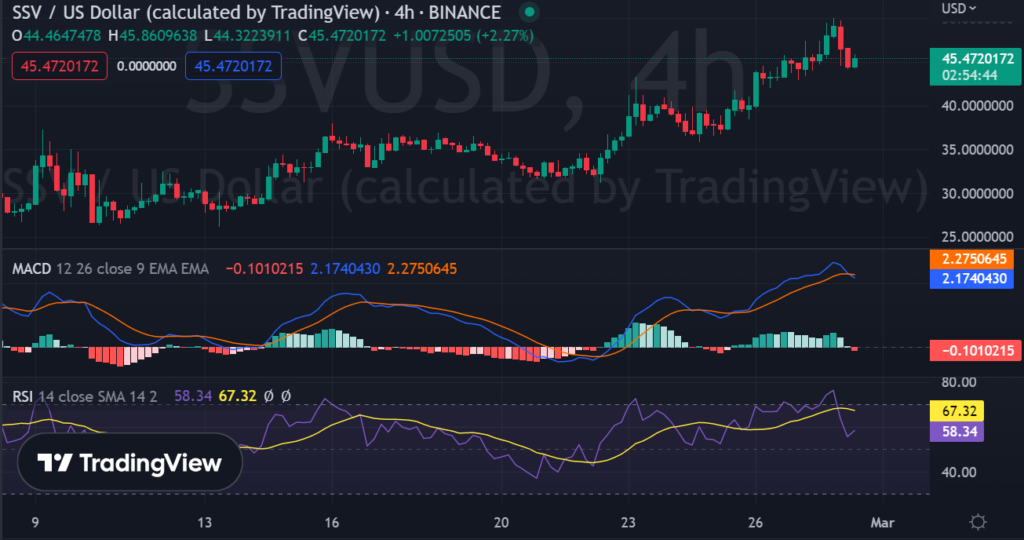
The daily RSI is bullish as it is hovering near the overbought region of 70. The MACD line is residing above the red signal line. Moreover, the price of SSV is challenging the SMA 20 curve as the cryptocurrency currently trades around $45.19.
SSV/USD technical analysis reveals the altcoin has formed a falling wedge pattern after a spark of selling pressure drove prices lower. If bulls can manage to break above the wedge pattern and the resistance at $50.0, a rebound towards $55.50 and beyond is possible in the near term.
Overall, SSV appears to be forming a symmetrical triangle as buyers struggle to break through resistance while sellers attempt to drive prices lower. If SSV falls below the $43.15 Fib level, a further decline toward $40.0 is expected in the coming days. On the other hand, if bulls break through resistance at $50.0 and hold above this level, an eventual bull run could be seen as prices target $55.50 and eventually $60.0.
Disclaimer: The views and opinions, as well as all the information shared in this price analysis, are published in good faith. Readers must do their own research and due diligence. Any action taken by the reader is strictly at their own risk. Coin Edition and its affiliates will not be held liable for any direct or indirect damage or loss.
Disclaimer: The information presented in this article is for informational and educational purposes only. The article does not constitute financial advice or advice of any kind. Coin Edition is not responsible for any losses incurred as a result of the utilization of content, products, or services mentioned. Readers are advised to exercise caution before taking any action related to the company.
: What Happens If You Use an Unlicensed Platform?")


