


- Bullish Stargate (STG) price prediction ranges from $0.3512 to $1.245
- Analysis suggests that the STG price might reach above $1.24
- The STG bearish market price prediction for 2023 is $0.3497
Table of contents
- What is Stargate Finance (STG)?
- Stargate Finance (STG) Market overview
- Stargate Finance (STG) Market Status
- Stargate Finance (STG) Price Analysis 2023
- Stargate Finance (STG) Price Prediction 2023-2030 Overview
- Stargate Finance (STG) Price Prediction 2023
- Stargate Finance (STG) Price Prediction 2024
- Stargate Finance (STG) Price Prediction 2025
- Stargate Finance (STG) Price Prediction 2026
- Stargate Finance (STG) Price Prediction 2027
- Stargate Finance (STG) Price Prediction 2028
- Stargate Finance (STG) Price Prediction 2029
- Stargate Finance (STG) Price Prediction 2030
- Stargate Finance (STG) Price Prediction 2040
- Stargate Finance (STG) Price Prediction 2050
- Conclusion
What is Stargate Finance (STG)?
Stargate Finance (STG) is an omnichain-native asset bridge designed to debunk the myths of blockchain trilemma, which states that no blockchain can be decentralized, secure, and scalable simultaneously. Stargate, allows users and Decentralized Applications (dApps) to transfer native assets cross-chain while accessing the protocol’s unified liquidity pools.
Stargate users can also move their assets between different liquidity pools on various decentralized finance (DeFi) protocols and dApps.
Moreover, the protocol supports transfers between eight chains: Ethereum, Avalanche, Polygon, Metis, BNB Chain, Arbitrum, Optimism and Fantom.
Usually pre-existing cross-chain bridges use what’s called fractured liquidity, which requires separate pools for tokens that will pass over the bridge– that connects two blockchains together. However, Stargate adjudicates the preceding as obsolete via a lock+mint and burn+redeem mechanism. The mechanism essentially burns the tokens at source and mints new ones on the destination blockchain, and therefore provides instant guaranteed finality and unified liquidity.
Stargate Finance (STG) Market overview
| 🪙 Name | Stargate Finance |
| 💱 Symbol | STG |
| 🏅 Rank | #710 |
| 💲 Price | $0.14179731109187 |
| 📊 Price Change (1h) | 0.05 % |
| 📊 Price Change (24h) | 2.01 % |
| 📊 Price Change (7d) | -7.86 % |
| 💵 Market Cap | $19980899.74615 |
| 💸 Circulating Supply | 140911697.07163 STG |
| 💰 Total Supply | 1000000000 STG |
Stargate Finance (STG) is currently trading at $0.14179731109187 and sits at number #710 on CoinMarketCap in terms of market capitalization. There are 140911697.07163 STG coins currently in circulation, bringing the total market cap to $19980899.74615.
Over the past 24 hours, Stargate Finance has increased by 2.01%. Looking at the last week, the coin is down by 7.86%.
Stargate Finance (STG) Market Status
The maximum supply of Stargate Finance (STG) is 1,000,000,000 STG coins, while its circulating supply is 178,913,042 STG coins, according to CoinMarketCap. At the time of writing, STG is trading at $0.8267 representing 24 hours decrease of 4.40%. The trading volume of IDEX in the past 24 hours is $38,260,299 which represents a 9.91% decrease.
Some top cryptocurrency exchanges for trading Idex (IDEX) are Binance, Kucoin, Uniswap v2, Bitfinex and Kraken.
Now that you know what STG is and its current market status, we shall discuss the price analysis of Stargate Finance (STG) for 2023.
Stargate Finance (STG) Price Analysis 2023
Will the STG blockchain’s most recent improvements, additions, and modifications help its price rise? Moreover, will the changes in the payment and crypto industry affect STG’s sentiment over time? Read more to find out about STG’s 2023 price analysis.
Stargate Finance (STG) Price Analysis – Bollinger Bands
The Bollinger bands are a type of price envelope developed by John Bollinger. It gives a range with an upper and lower limit for the price to fluctuate. The Bollinger bands work on the principle of standard deviation and period (time).
The upper band as shown in the chart is calculated by adding two times the standard deviation to the Simple Moving Average while the lower band is calculated by subtracting two times the standard deviation from the Simple Moving Average.
When this setup is used in a cryptocurrency chart, we could expect the price of the cryptocurrency to abide within the upper and lower bounds of the Bollinger bands 95% of the time.
The above thesis is derived from an Empirical law also known as the three-sigma rule or the 68-95-99.7 which states that almost all observed data for a normal distribution (normal scattering of data) will fall within three standard deviations.
As such for a data set that follows a normal distribution, 68% of data will fall within 1 standard deviation of the mean, while 95% of data for the normal distribution will fall within 2 standard deviations of the mean and 99.7% of data will fall within 3 standard deviations of the mean.
Hence, as the Bollinger bands are calculated using two standard deviations, we could expect STG to abide within the Bollinger bands 95% of the time. (i.e whenever the cryptocurrency touched the upper band, the chances of it coming down are 95%.). This concept applies vice-versa as well.
Moreover, the sections highlighted by red rectangles show how the bands expand and contract. When the bands widen, we could expect more volatility, and when the bands contract, it denotes less volatility. The bands widths have been quite constant lately, hence, we could say that the market is saturated.
Moreover, when considering the direction of the Bollinger bands we could see that it is placed parallel with the horizontal axis. As such, we may see STG consolidate with a larger amplitude.
Notably, the Bollinger Band behaves very closely with the Keltner channel. For instance, if you were to use both the Bollinger bands and Keltner channel indicators for a cryptocurrency, you would see that almost most of the time both indicators overlap.
However, the only difference between with Bollinger band and the Keltner channel is that the Bollinger bands use Standard Deviation while the Keltner channel uses Average True Range for calculating its bands which are the top and bottom limits.
Stargate Finance (STG) Price Analysis – Relative Strength Index
The Relative Strength Index is an indicator that is used to find out whether the price of a security is overvalued or undervalued. As per its name, RSI indicators help determine how the security is doing at present, relative to its previous price.
Moreover, it has a signal line which is a Simple Moving Average (SMA) that acts as a yardstick or reference to the RSI line. Hence, whenever the RSI line is above the SMA it is considered bullish and if it’s below the SMA then it is bearish.
When considering the first green rectangle from the left of the chart below we can see that the RSI line (purple) is above the Signal line (yellow). As such, STG is bullish or gaining value. Therefore it is reaching higher highs as shown in the chart.
The second green rectangle shows that the RSI is below the signal. Hence, STG is bearish as it is making lower lows.
Currently, the RSI of STG is at 53.93 and is above the Signal line. This shows that the trend is strong. Furthermore, the RSI is parallel to the horizontal axis hence, we could expect the prices of STG to increase more.
To deduce whether a cryptocurrency is bearish or bullish, the RSI compares the gains of the securities against the losses it made in the past. This ratio of gains against the losses is then deducted from the 100.
If the answer is equal to or less than 30, then we call that the price of the security is in the oversold region.
This means that many are selling the security in the market, and as such the security is undervalued. Moreover, as per the Supply-demand curve theory, the price is supposed to drop when there is an increase in supply.
If the answer is equal to or greater than 70 then the security is overbought as many are buying. Since many want to buy the security the demand increases which intuitively increases the prices.
Additionally, the RSI could be used to determine how strong a trend is. For instance, when a cryptocurrency is bullish or reaching higher highs, then the RSI line also should be making higher highs in unison.
For instance, if the RSI is making lower highs when the cryptocurrency is making higher highs, then we may say that although the token/coin is on a bullish trend it is losing value. As such, there could be a trend reversal in the future.
However, the RSI could also give false alarms for breakouts. Although we may expect, the prices to retrace if it goes to the oversold or overbought region, the prices also can stay in the oversold or overbought region for an extended period. As such, traders should be wary of it and let the market saturate before making vital decisions.
Stargate Finance (STG) Price Analysis – Moving Average
The Exponential Moving averages are quite similar to the simple moving averages (SMA). However, the SMA equally distributes down all values whereas the Exponential Moving Average gives more weightage to the current prices. Since SMA undermines the weightage of the present price, the EMA is used in price movements.
The 200-day MA is considered to be the long-term moving average while the 50-day MA is considered the short-term moving average in trading. Based on how these two lines behave, the strength of the cryptocurrency or the trend can be determined on average.
In particular, when the short-term moving average (50-day MA) approaches the long-term moving average (200-day MA) from below and crosses it, we call it a Golden Cross.
Contrastingly, when the short-term moving average crosses the long-term moving average from above then, a death cross occurs.
Usually, when a Golden Cross occurs, the prices of the cryptocurrency will shoot up drastically, but when there’s a Death Cross, the prices will crash.
Whenever the price of cryptocurrency is above the 50-day or 200-day MA, or above both we may say that the coin is bullish (red rectangle). Contrastingly, if the token is below the 50-day or 200-day, or below both, then we could call it bearish (Green triangle section).
As highlighted by the circles, we could see that STG tested the 50-day MA on numerous occasions but wasn’t able to break above it. However, the dawn of 2023 brought some momentum to STG. This helped the token break the 50-day MA.
Currently, STG is above the 50-day MA. However, if the bears take over the market in the future. STG may seek the assistance of the 50-day MA. If the 50-day MA does not support, then it would seek assistance from the 200-day MA.
Stargate Finance (STG) Price Prediction 2023-2030 Overview
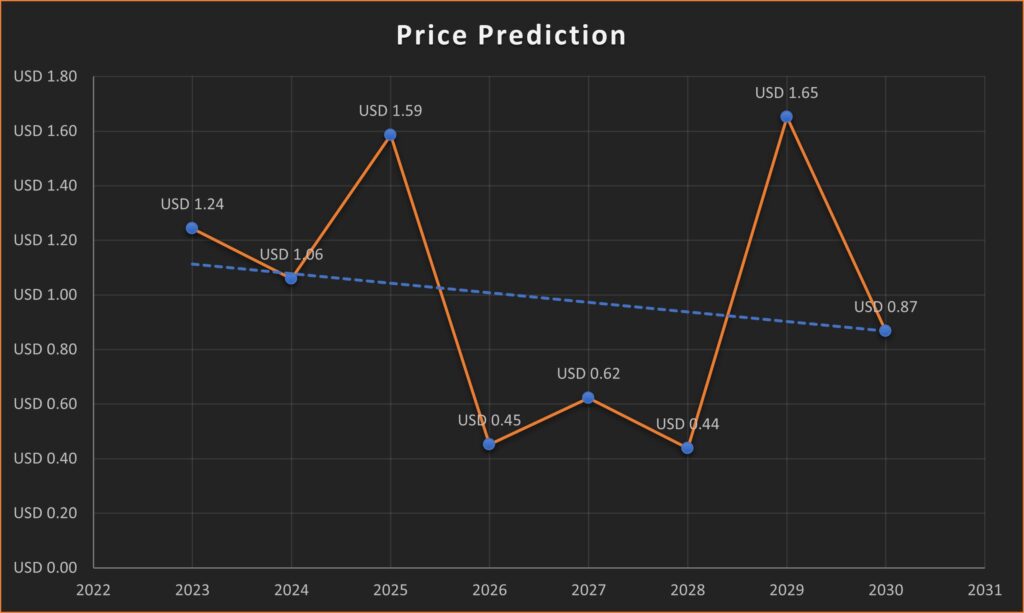
| Year | Minimum Price | Average Price | Maximum Price |
| 2023 | $1.115 | $1.2438 | $1.3251 |
| 2024 | $0.9951 | $1.0593 | $1.1223 |
| 2025 | $1.4352 | $1.5859 | $1.6725 |
| 2026 | $0.3980 | $0.4518 | $0.4915 |
| 2027 | $0.5728 | $0.6228 | $0.7162 |
| 2028 | $0.3227 | $0.4379 | $0.5012 |
| 2029 | $1.5723 | $1.6515 | $1.7010 |
| 2030 | $0.7023 | $0.8671 | $0.8923 |
| 2040 | $0.4921 | $0.5162 | $0.6241 |
| 2050 | $0.1541 | $0.1652 | $0.2651 |
Stargate Finance (STG) Price Prediction 2023
When considering the chart above, we could see that STG’s exponential rise had been disrupted by a fall that crashed STG from the Resistance 2 at $1.24 to Support 1 at $0.61 within a short period of time. Since March 2023 STG has been fluctuating within the Resistance 1 and Support 1 range.
Moreover, when considering the fluctuation pattern we could see that STG seems to be reciprocating its September 2022 pattern currently. If its actually reciprocating that pattern then we could expect STG to crash and fall Support 3 at $0.35. However, STG may rebound on the Support 1 and Support 2.
In the event that STG’s fall is held up by Support 1, then STG could surge to Resistance 1. But if Support 1 fails and Support 2 at $0.46 comes to STG’s rescue, then it could surge to Resistance 2 at 1.24.
In another scenario, STG may not seek the assistance of Support 1 and may straight away surge to Resistance 2.
Stargate Finance (STG) Price Prediction – Resistance and Support Levels
The chart above shows how STG has been descending though the Resistance levels. The green spike at the very beginning of the chart could be due to the excitement that the traders have on a new token. However, overtime we see that STG descended in an inverse exponential patten.
Nonetheless, the dawn of 2023 brought some hope as STG surged from Support 2 to Resistance 3 briskly. The chart outlines the head shoulders pattern taken by STG.
When comparing the left and the right shoulders, we could see that the right shoulder has a higher gradient while the left shoulder is flat. This shows that though the bears pushed STG down, the bulls are fighting back. Hence, if STG is to fall to Support 1 it may present an excellent entry point for traders.
Stargate Finance (STG) Price Prediction 2024
There will be Bitcoin halving in 2024, and hence we should expect a positive trend in the market due to user sentiments and the quest by investors to accumulate more of the coin. Since the Bitcoin trend affects the direction of trade of other cryptocurrencies, we could expect Stargate Finance (STG) to trade at a price not below $1.0593 by the end of 2024.
Stargate Finance (STG) Price Prediction 2025
Stargate Finance (STG) may still experience the after-effects of the Bitcoin halving and is expected to trade above its 2024 price. Many trade analysts speculate that BTC halving could create a huge impact on the crypto market. Moreover, similar to many altcoins, Stargate Finance will continue to rise in 2025 forming new resistance levels. It is expected that Stargate Finance would trade beyond the $1.5859 level.
Stargate Finance (STG) Price Prediction 2026
It is expected that after a long period of bull run, the bears would come into power and start negatively impacting the cryptocurrencies. During this bearish sentiment, Stargate Finance could tumble into its support regions. During this period of price correction, Stargate Finance could lose momentum and be a little below its 2025 price. As such it could be trading at $0.4518 by 2026.
Stargate Finance (STG) Price Prediction 2027
Naturally, traders expect a bullish market sentiment after the crypto industry was affected negatively by the bears’ claw. Moreover, the build-up to the next Bitcoin halving in 2028 could evoke excitement in traders. As such we could expect Stargate Finance to trade at around $0.6228 by the end of 2027.
Stargate Finance (STG) Price Prediction 2028
As the crypto community’s hope will be re-ignited looking forward to Bitcoin halving like many altcoins, Stargate Finance will continue to form new higher highs and is expected to move in an upward trajectory. Hence, Stargate Finance would be trading at $0.4379 after experiencing a massive surge by the end of 2028.
Stargate Finance (STG) Price Prediction 2029
2029 is expected to be another bull run due to the aftermath of the BTC halving. However, traders speculate that the crypto market would gradually become stable by this year. In tandem with the stable market sentiment and the slight price surge expected after the aftermath, Stargate Finance could be trading at $1.6515 by the end of 2029.
Stargate Finance (STG) Price Prediction 2030
After witnessing a bullish run in the market, Stargate Finance and many altcoins would show signs of consolidation and might trade sideways and move downwards for some time while experiencing minor spikes. Therefore, by the end of 2030, Stargate Finance could be trading at $0.8671.
Stargate Finance (STG) Price Prediction 2040
The long-term forecast for Stargate Finance indicates that this altcoin could reach a new all-time high(ATH). This would be one of the key moments as HODLERS may expect to sell some of their tokens at the ATH point.
However, Stargate Finance may face a slight fall before starting its upward journey once again. It is expected that the average price of Stargate Finance could reach $0.5162 by 2040.
Stargate Finance (STG) Price Prediction 2050
The community believes that there will be widespread adoption of cryptocurrencies, which could maintain gradual bullish gains. By the end of 2050, if the bullish momentum is maintained, STG could surpass the resistance level of $0.1652
Conclusion
As said above, the price of Stargate Finance (STG) may even reach above $1.25 if investors have decided that the cryptocurrency is a good investment, along with mainstream cryptocurrencies.
Stargate Finance (STG) is an omnichain-native asset bridge that has been designed for a blockchain to be decentralized, secure, and fast simultaneously.
STG can be traded on many exchanges like other digital assets in the crypto world. It could be tarded on Binance, Coinbase, KuCoin, and Kraken. It is also available on DEX like Uniswap and PancakeSwap.
STG has a possibility of surpassing its present all-time high (ATH) price of $4.2838 in 2022.
STG has been making lower highs during the last seven days, especially after forming the head and shoulders pattern. However, once buyers start buying the dip it will recover abruptly reaching $1.25.
STG is a good investment, especially since it allows the user to swap their asset to different blockchains and Dapps.
STG has a present all-time low price of $0.1016.
Stargate Finance was built by LayerZero Labs.
Stargate Finance has a maximum supply of 1,000,000,000 STG coins.
Stargate Finance was launched in March 2022.
STG can be stored in a cold wallet, hot wallet, or exchange wallet.
STG is expected to reach $1.0593 by 2024.
STG is expected to reach $1.5859 by 2025.
STG is expected to reach $0.4518 by 2026.
STG is expected to reach $0.6228 by 2027.
STG is expected to reach $0.4379 by 2028.
STG is expected to reach $1.6515 by 2029.
STG is expected to reach $ 0.8671 by 2030.
STG is expected to reach $0.5162 by 2040.
STG is expected to reach $0.1652 by 2050.
Disclaimer: The views and opinions, as well as all the information shared in this price prediction, are published in good faith. Readers must do their research and due diligence. Any action taken by the reader is strictly at their own risk. Coin Edition and its affiliates will not be held liable for any direct or indirect damage or loss.
Disclaimer: The information presented in this article is for informational and educational purposes only. The article does not constitute financial advice or advice of any kind. Coin Edition is not responsible for any losses incurred as a result of the utilization of content, products, or services mentioned. Readers are advised to exercise caution before taking any action related to the company.
 Price Prediction 2026-2030: Will TRX Hit $0.50 Soon?")
 Price Prediction 2026-2050: Will HYPE Hit $100 Soon?")


: What Happens If You Use an Unlicensed Platform?")