
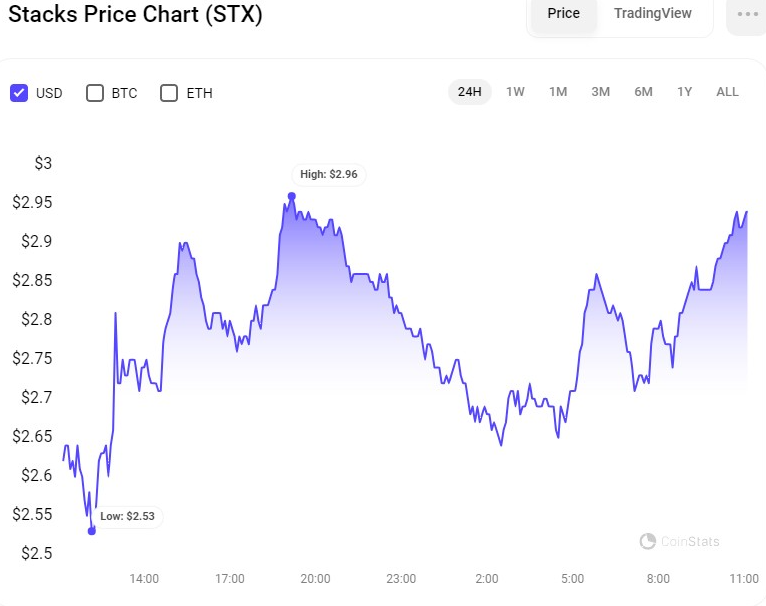
- STX rebounds to $2.94, up 13.56% in 24 hours amid market turbulence.
- Bitcoin’s dip below $62k triggers altcoin market correction.
- STX shows bullish signs with RSI at 59.95 and MACD crossing positive.
Cryptocurrency markets have faced a challenging week as investors opted to secure profits, leading to a pause in the macro uptrend. In the same way, Stacks (STX), the layer 2 network aimed at making Bitcoin more functional, has been subject to high volatility. However, after a steep fall to $2.47, STX made a rebound towards $2.90, amid market instability.
Bitcoin Leads Market Correction
The selloff was led by Bitcoin, which suffered a huge pullback from its previous week’s high above $73,000. The fall pushed Bitcoin below the $62,000 level, causing a big correction across the altcoin market.
During the market downturn, Stacks demonstrated great resilience, rebounding to $2.96 before encountering some selling pressure. This recovery is reflected in the digital asset’s 24-hour trading volume, which reached approximately $513,366,116, up 248%.
The rebound represents a favorable market reaction to Stacks, which has led to a 13.56% increase in its price in the last 24 hours and, therefore, trading at $2.94 at press time. According to CoinMarketCap data, Stacks is 29th in terms of market capitalization, with a valuation of more than $4.25 billion.
STX/USD Technical Analysis
The Relative Strength Index (RSI) on the STXUSD 4-hour price chart is 59.95, showing that Stacks is now in a neutral trading zone with room for more price movement. The rising movement of the RSI suggests a positive trend for Stacks in the short term, with resistance levels at $3.00 and $3.20 to monitor for potential price breakouts.
If the RSI continues to rise and crosses the overbought level of 70, we may witness more buying pressure and a surge in the price of Stacks. However, traders should be wary of potential pullbacks if the RSI begins to fall from its present levels.
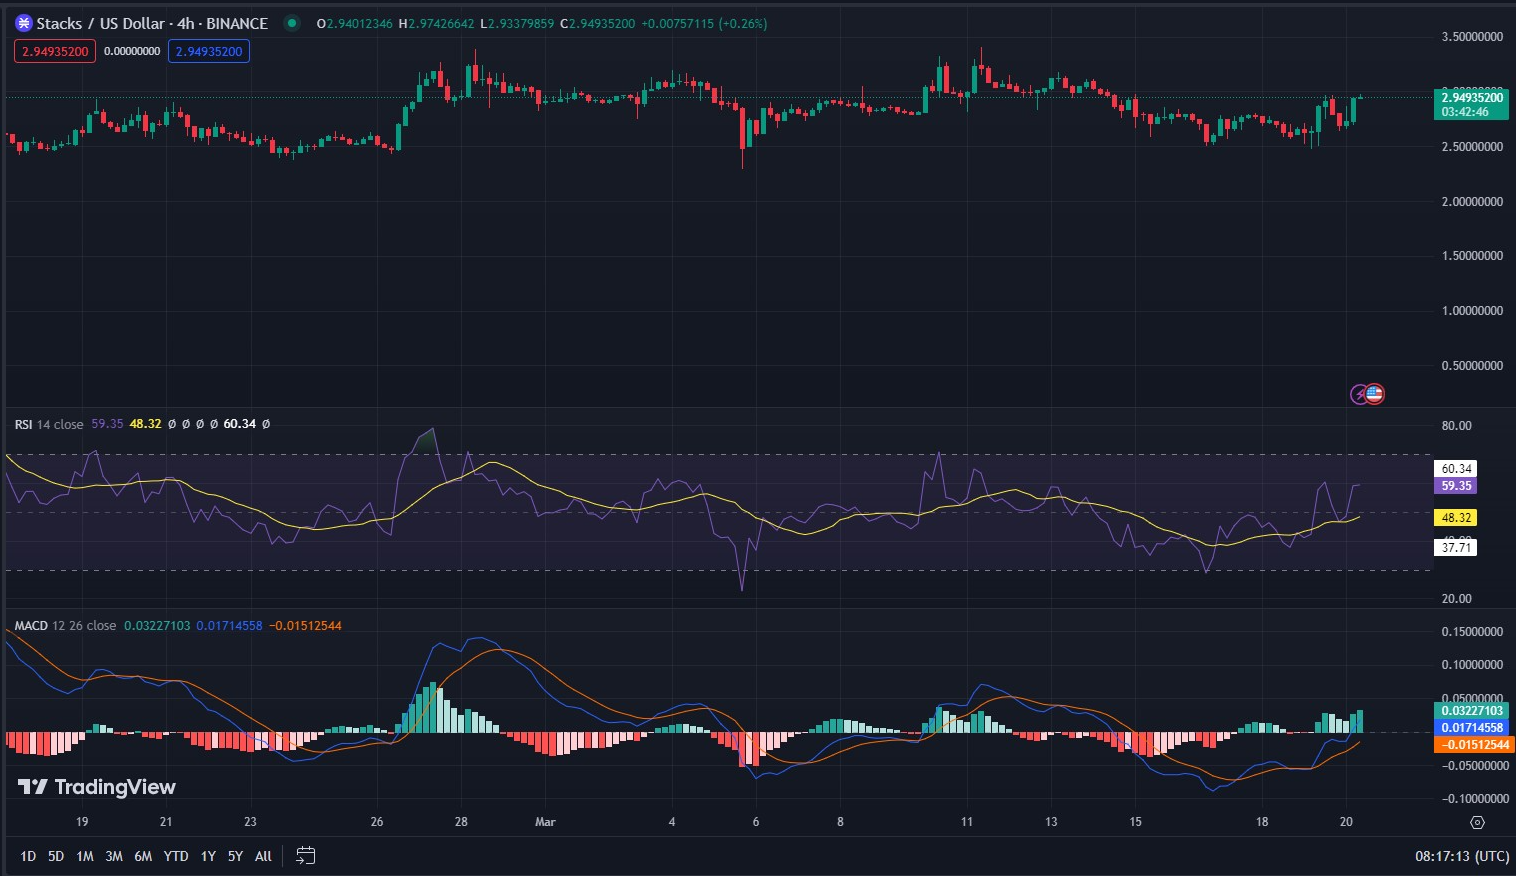
In addition, the Moving Average Convergence Divergence (MACD) indicator shows a bullish crossing, which supports Stacks’ short-term price trend. The shift into the positive zone indicates that momentum is rising in favor of buyers, suggesting that the upward rise may continue. This might draw more investors trying to capitalize on the positive momentum, driving up the price of Stacks. The histogram also shows a surge in bullish momentum, which confirms the possibility of sustained price increases.
Disclaimer: The information presented in this article is for informational and educational purposes only. The article does not constitute financial advice or advice of any kind. Coin Edition is not responsible for any losses incurred as a result of the utilization of content, products, or services mentioned. Readers are advised to exercise caution before taking any action related to the company.


