


- Bullish Sweat Economy (SWEAT) price prediction ranges from $0.0100 to $0.100.
- Analysis suggests that the SWAET price might reach above $0.0165.
- The SWEAT bearish market price prediction for 2023 is $0.0042.
Sweat Economy is an Ethereum-based fitness app that rewards its users for being healthy. Its native token is denoted as SWEAT.
SWEAT investors are bullish on the token since it has had a return on investment (ROI) of over 783% in the past two days. Its all-time high (ATH) of $0.9999 was attained in September 2022. Irrespective of the recent crypto winter, which led to a dip in the price of most cryptocurrencies, SWEAT investors are confident that the future of SWEAT is bullish.
If you are interested in the future of the Sweat Economy (SWEAT) and want to know the price analysis and prediction of SWEAT for 2023, 2024, 2025, 2026, up to 2030, keep reading this Coin Edition article.
Table of contents
- Sweat Economy (SWEAT) Market Overview
- What is Sweat Economy (SWEAT)?
- Sweat Economy Current Market Status
- Sweat economy Price Analysis 2023
- Sweat Economy (SWEAT) Price Prediction 2023-2030 Overview
- Sweat Economy (SWEAT) Price Prediction-2023
- Sweat Economy (SWEAT) Price Prediction 2024
- Sweat Economy (SWEAT) Price Prediction 2025
- Sweat Economy (SWEAT) Price Prediction 2026
- Sweat Economy (SWEAT) Price Prediction 2027
- Sweat Economy (SWEAT) Price Prediction 2028
- Sweat Economy (SWEAT) Price Prediction 2029
- Sweat Economy (SWEAT) Price Prediction 2030
- Sweat Economy (SWEAT) Price Prediction 2040
- Sweat Economy (SWEAT) Price Prediction 2050
- Conclusion
- FAQ
- More Crypto Price Predictions:
Sweat Economy (SWEAT) Market Overview
HTTP Request Failed... Error: file_get_contents(https://pro-api.coinmarketcap.com/v2/cryptocurrency/quotes/latest?slug=sweatcoin): Failed to open stream: HTTP request failed! HTTP/1.1 400 Bad Request
What is Sweat Economy (SWEAT)?
Sweat Economy is one of the fitness apps that rewards its users for getting involved in some physical activity. Sweatcoin ranks first for the most downloaded health and fitness app in 58 countries. Moreover, it has 110 million users worldwide.
Sweat Economy which is present both in the Ethereum and Near Protocol blockchains was founded by Oleg Fomengo, Egor Khmelev, and Anton Derlyatka in 2015. Oleg Fomengo is the CEO of Sweat Economy.
Users are rewarded with an in-app currency — Sweatcoin, a non-crypto virtual token that acts as a monetary incentive given as a reward to users for their physical activity. Users who own Sweatcoin can now swap or exchange it for Sweat Economy (SWEAT). They can also generously donate their tokens to charities within the platform. Sweat Economy is one of the fitness apps that rewards its users.
Users can earn rewards by staking their SWEAT. Staked SWEAT token gives a user the ability to enjoy premium services, low transaction fees, and the ability to mint more Sweat Economy.
In the future, it plans to integrate the ability to purchase Sweat Economy (SWEAT) with fiat by debits to credit cards. It also plans to include games on NFTs in the app. Users who own Sweatcoin can now swap or exchange it for Sweat Economy (SWEAT).
Sweat Economy Current Market Status
The maximum supply of Sweat Economy (SWEAT) is unavailable, while its circulating supply is 6,562,485,707 SWEAT, according to CoinMarketCap. At the time of writing, SWEAT is trading at $0.00696 representing 24 hours increase of 2.20%. The trading volume of SWEAT in the past 24 hours is $3,741,775 which represents a 43.95% increase.
Some top cryptocurrency exchanges for trading Sweat Economy (SWEAT) are OKX, Bybit, Bitfinex, and Kucoin
Now that you know SWEAT and its current market status, we shall discuss the price analysis of Sweat Economy (SWEAT) for 2023.
Sweat economy Price Analysis 2023
Will the SWEAT’s blockchain’s most recent improvements, additions, and modifications help its price rise? Moreover, will the changes in the payment and crypto industry affect SWEAT’s sentiment over time? Read more to find out about SWEAT’s 2023 price analysis.
Sweat Economy (SWEAT) Price Analysis – Bollinger Bands
The Bollinger bands are a type of price envelope developed by John Bollinger. It has an Upper band, a Lower band, and a Simple Moving Average (SMA). The upper band gives the top limit and the lower band gives the lower limit for the price to fluctuate. The Bollinger bands work on the principle of standard deviation and period (time).
As such whenever the price of the cryptocurrency reaches the upper or lower band, the chances of it retracing are 95%. When the bands widen, it shows there’s going to be more volatility and when they contract, there is less volatility.
The sections highlighted by red rectangles in the chart above show how the bands expand and contract. When the bands widen, we could expect more volatility, and when the bands contract, it denotes less volatility. The green rectangles show how SWEAT retraced after continuously touching the upper band (overbought).
Currently, SWEAT is hugging the upper Bollinger band and a candlestick has crossed above the upper band, hence it is overbought. Since SWEAT seems to be overbought, we may see its price retrace toward the SMA.
As shown in the chart above it could be seen that in early 2023 SWEAT had a short uptrend until about mid-February. After that short uptrend SWEAT has been reaching lower and lower. However, there was some period of consolidation which the Multi Bollinger band super trend indicates as an uptrend.
Currently, after reaching its lowest point SWEAT seems to be on an uptrend once again. Although, on the daily chart SWEAT has touched the upper Bollinger and could be anticipated a retracement, the longer time frame has something else to say.
SWEAT is currently converging the SMA on its way up after touching the lower band. This is the first time SWEAT is touching the SMA after February 2023. Since SWEAT seems to have gained some momentum, we could expect it to touch the upper Bollinger band in the long term.
The BBW high-low indicator has been quite constant denoting that the bandwidth has hardly changed, However, when the buyers spot the long-term benefits of SWEAT, they might enter the market making the demand rise. This could create a ripple effect on the price and the volatility could increase with the price.
Sweat Economy (SWEAT) Price Analysis- Relative Strength Index
The Relative Strength Index is an indicator that is used to find out whether the price of a security is overvalued or undervalued. As per its name, RSI indicators help determine how the security is doing at present, relative to its previous price.
As such, the indicator has a signal line which is a Simple Moving Average (SMA) that acts as a yardstick or reference to the RSI line. Hence, whenever the RSI line is above the SMA, it is considered bullish; if it’s below the SMA, it is bearish.
Currently, the RSI reads a value of 66.41 and the line seems to be heading towards the overbought region. If the buyers keep on pushing the price, the RSI could reach the overbought region shortly.
Moreover, when looking at the longer timeframe it could be seen that while the RSI has been making higher highs, the price of SWEAT has been making lower highs. This is a bullish divergence. Hence, we could expect the prices of SWEAT to increase in the future. As such, the RSI also may increase.
Sweat Economy (SWEAT) Price Analysis- Moving Average
The Exponential Moving averages are quite similar to the simple moving averages (SMA). However, the SMA equally distributes down all values whereas the Exponential Moving Average gives more weightage to the current prices. Since SMA undermines the weightage of the present price, the EMA is used in price movements.
The 200-day EMA is considered to be the long-term moving average while the 50-day EMA is considered the short-term moving average in trading. Based on how these two lines behave, the strength of the cryptocurrency or the trend can be determined on average
When considering the chart above, we could see that both moving averages are heading downwards, as such, SWEAT is bearish. SWEAT has just crossed above the 50-day EMA and is currently testing the 100-day EMA after it touched it in February 2023. If SWEAT continues rising there is a possibility that SWEAT could reach $0.0098. And if it breaks this resistance SWEAT could reach $0.0142.
Sweat Economy (SWEAT) Price Prediction 2023-2030 Overview
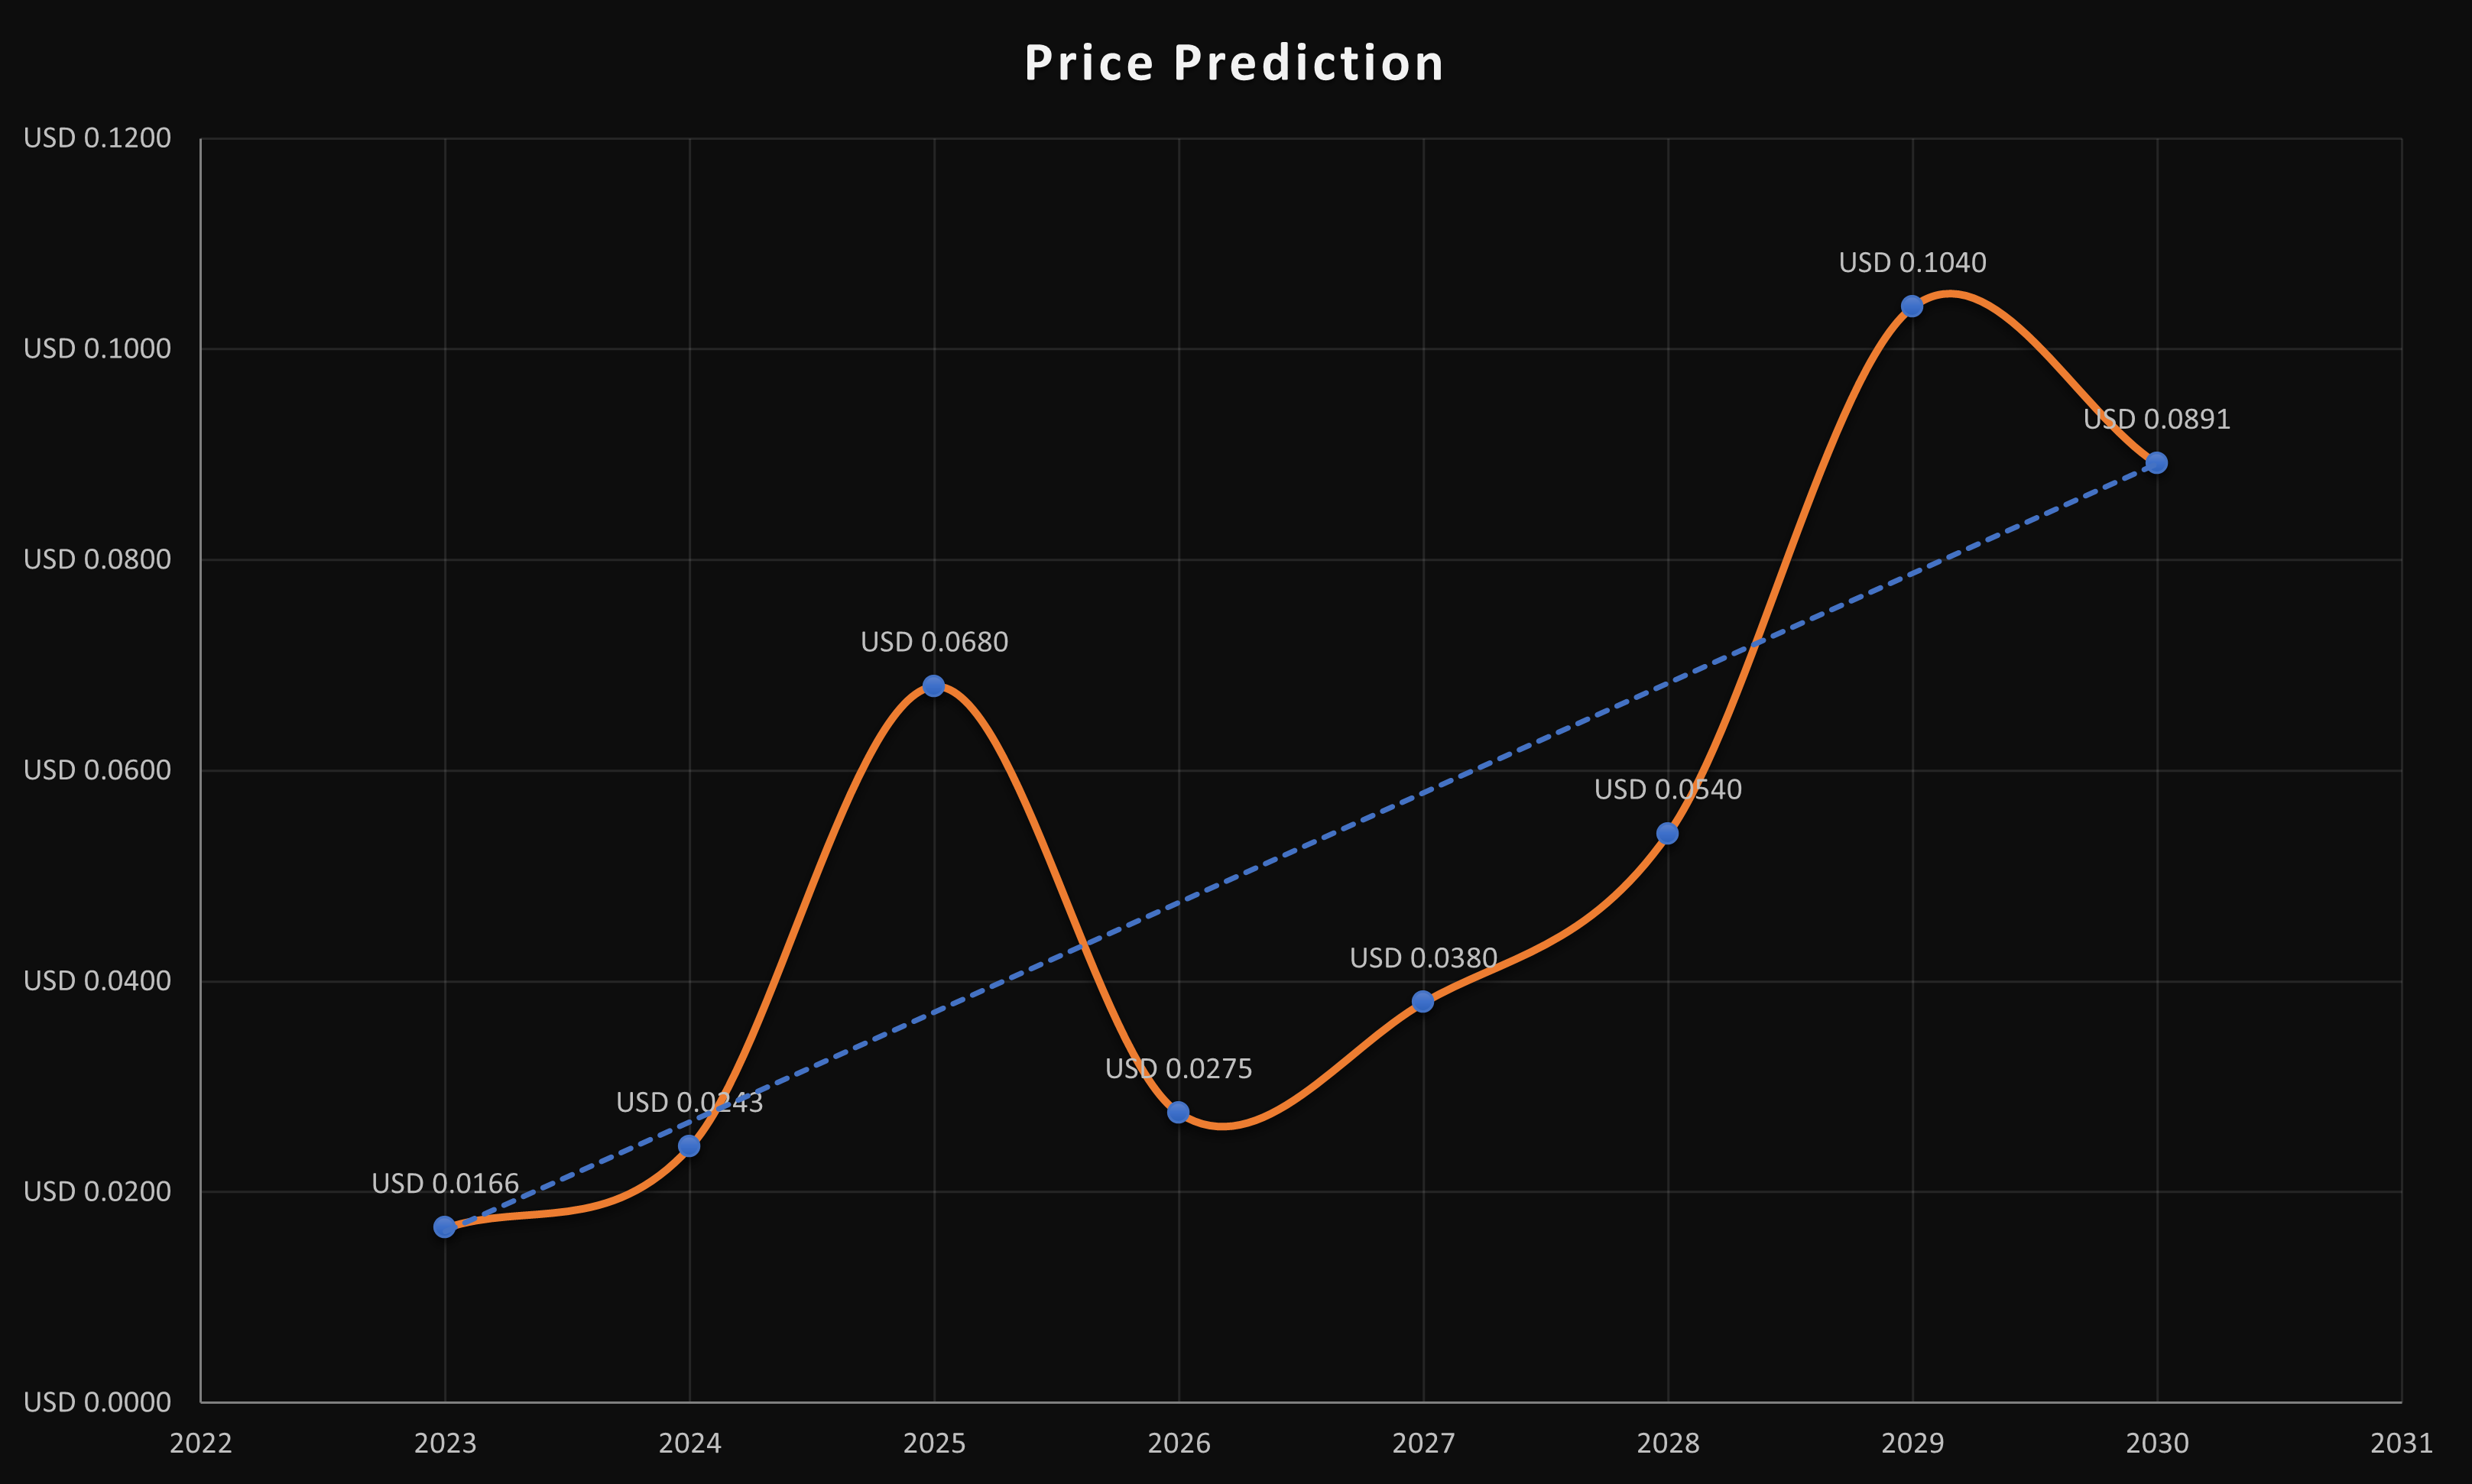
| Year | Minimum Price | Average Price | Maximum Price |
| 2023 | $0.0150 | $0.0166 | $0.0175 |
| 2024 | $0.0220 | $0.0243 | $0.0275 |
| 2025 | $0.0620 | $0.0680 | $0.0725 |
| 2026 | $0.0250 | $0.0275 | $0.0290 |
| 2027 | $0.0300 | $0.0380 | $0.0420 |
| 2028 | $0.0520 | $0.0540 | $0.0580 |
| 2029 | $0.0950 | $0.1040 | $0.1100 |
| 2030 | $0.0850 | $0.0891 | $0.0950 |
| 2040 | $0.0900 | $0.1939 | $0.2500 |
| 2050 | $0.2550 | $0.2973 | $0.3800 |
Sweat Economy (SWEAT) Price Prediction-2023
The above chart shows that SWEAT has been on a downtrend since the beginning of 2023. The trend line shows that SWEAT has been making lower lows. However, after reaching Support 1 at $0.0045 the descending trend for SWEAT seems to have faded away. As shown in the chart there seems to be a new trend line in the making for SWEAT.
If SWEAT continues to rise along the trend line (blue), then we could expect it to reach Resistance 2 at $0.0166. However, on its rise to Resistance 2, there may be some friction for the price to move upwards at Resistance 1 ($0.0100).
In the event that SWEAT breaks out from following the current trendline (blue), then, it may reach for support from the white trendline and start to rise. If the bears take over the market at the trendline, then, SWEAT could fall to unprecedented support levels.
Sweat Economy (SWEAT) Price Prediction – Resistance and Support Levels
The above chart shows that SWEAT has been falling since last November until the beginning of 2023. However, the dawn of 2023 rejuvenated the bulls and SWEAT started to rise along the 1:1 Gann fan line. After reaching $0.0175 the token started to descend. It started descending in February 2023 and while it was descending it tested the 2:1 Gann fan line but was unable to break it until early July.
Currently, after successfully breaking the 2:1 Gann line, SWEAT is testing the 8:1 Gann line. As such, we could expect it to break it. In the event that it is rejected at the above-mentioned level then SWEAT may seek assistance from the $0.0042 level.
Sweat Economy (SWEAT) Price Prediction 2024
There will be Bitcoin halving in 2024, and hence we should expect a positive trend in the market due to user sentiments and the quest by investors to accumulate more of the coin. However, the year of BTC halving didn’t yield the maximum SWEAT based on the previous halving. Hence, we could expect SWEAT to trade at a price, not below $0.0243 by the end of 2024.
Sweat Economy (SWEAT) Price Prediction 2025
SWEAT may experience the after-effects of the Bitcoin halving and is expected to trade much higher than its 2024 price. Many trade analysts speculate that BTC halving could create a huge impact on the crypto market. Moreover, similar to many altcoins, SWEAT will continue to rise in 2025 forming new resistance levels. It is expected that SWEAT would trade beyond the $0.0680 level.
Sweat Economy (SWEAT) Price Prediction 2026
It is expected that after a long period of bull run, the bears would come into power and start negatively impacting the cryptocurrencies. During this bearish sentiment, SWEAT could tumble into its support regions. During this period of price correction, SWEAT could lose momentum and be way below its 2025 price. As such it could be trading at $0.0275 by 2026.
Sweat Economy (SWEAT) Price Prediction 2027
Naturally, traders expect a bullish market sentiment after the crypto industry was affected negatively by the bears’ claw. Moreover, the build-up to the next Bitcoin halving in 2028 could evoke excitement in traders. However, there’ll be a dip in price before the excitement will be reciprocated in SWEAT. As such we could expect SWEAT to trade at around $0.0380 by the end of 2027.
Sweat Economy (SWEAT) Price Prediction 2028
As the crypto community’s hope will be re-ignited looking forward to Bitcoin halving like many altcoins, SWEAT may reciprocate its past behavior during the BTC halving. Hence, SWEAT would be trading at $0.0540 after experiencing a considerable surge by the end of 2028.
Sweat Economy (SWEAT) Price Prediction 2029
2029 is expected to be another bull run due to the aftermath of the BTC halving. However, traders speculate that the crypto market would gradually become stable by this year. In tandem with the stable market sentiment, SWEAT could be trading at $0.1040 by the end of 2029.
Sweat Economy (SWEAT) Price Prediction 2030
After witnessing a bullish run in the market, SWEAT and many altcoins would show signs of consolidation and might trade sideways and move downwards for some time while experiencing minor spikes. Therefore, by the end of 2030, SWEAT could be trading at $0.483
Sweat Economy (SWEAT) Price Prediction 2040
The long-term forecast for SWEAT indicates that this altcoin could reach a new all-time high(ATH). This would be one of the key moments as HODLERS may expect to sell some of their tokens at the ATH point.
If they start selling then SWEAT could fall in value. It is expected that the average price of SWEAT could reach $0.1939 by 2040.
Sweat Economy (SWEAT) Price Prediction 2050
The community believes that there will be widespread adoption of cryptocurrencies, which could maintain gradual bullish gains. By the end of 2050, if the bullish momentum is maintained, SWEAT could hit $0.2973
Conclusion
If investors continue showing their interest in SWEAT and add these tokens to their portfolio, it could continue to rise. SWEAT’s bullish price prediction shows that it could reach the $0.0165 level.
FAQ
Sweat Economy is an Ethereum-based cryptocurrency that rewards its uses for exercising and health. Its native token is called SWEAT. Sweat Economy is present both in the Ethereum and Near Protocol blockchain. During its initial coin offering, it generated $13 million.
Some top cryptocurrency exchanges for trading Sweat Economy (SWEAT) are KuCoin, OKX, Bynit, Bitget, Hotcoin Global, BingX, and others
SWEAT has a low possibility of surpassing its present all-time high (ATH) price of $0.9999 in 2022. However, due to the positive sentiments of its investors, this could be reached by 2023.
SWEAT is one of the few cryptocurrencies that has gained value in the past seven days. If SWEAT spikes it could rise to $0.0165.
SWEAT has been one of the most suitable investments in the crypto space. It is highly volatile, as such, it has quite a margin when its price fluctuates. Hence, traders may be allured to invest in SWEAT. It’s a good investment in the short term and in the long term as well.
SWEAT has a current all-time low price of $0.0070, according to CoinGecko.
The CEO of Sweat Economy is Oleg Flamengo.
SWEAT has a maximum supply that is unknown.
It was launched in 2022.
SWEAT can be stored in private and cold and hot wallets of centralized exchanges.
SWEAT is expected to reach $0.0166 by 2023.
SWEAT is expected to reach $0.0243 by 2024.
SWEAT is expected to reach $0.0680 by 2025.
SWEAT is expected to reach $0.0275 by 2026.
SWEAT is expected to reach $0.0380 by 2027.
SWEAT is expected to reach $0.0540 by 2028.
SWEAT is expected to reach $0.1040 by 2029.
SWEAT is expected to reach $0.0891 by 2030.
SWEAT is expected to reach $0.1939 by 2040.
SWEAT is expected to reach $0.2973 by 2050.
Disclaimer: The views and opinions, as well as all the information shared in this price prediction, are published in good faith. Readers must do their research and due diligence. Any action taken by the reader is strictly at their own risk. Coin Edition and its affiliates will not be held liable for any direct or indirect damage or loss.
More Crypto Price Predictions:
- Golem (GLM) Price Prediction 2023-2030
- Helium (HNT) Price Prediction 2023-2030
- BinaryX (BNX) Price Prediction 2023-2030
- Oasis Network (ROSE) Price Prediction 2023-2030
- The Sandbox (SAND) Price Prediction 2023-2030
Disclaimer: The information presented in this article is for informational and educational purposes only. The article does not constitute financial advice or advice of any kind. Coin Edition is not responsible for any losses incurred as a result of the utilization of content, products, or services mentioned. Readers are advised to exercise caution before taking any action related to the company.


