


- According to recent pricing analysis, the bear’s supremacy in MATIC has been threatened.
- Prices may tend to rise higher if MATIC prices break out over the $0.8042 resistance level.
- Technical indicators suggest that the bulls may grab power in the near future.
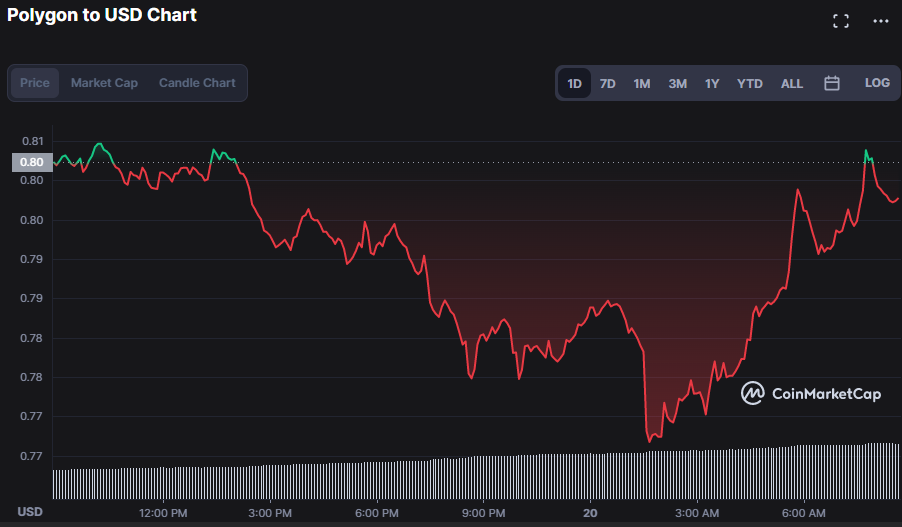
Even though the Polygon (MATIC) market started the day with strong momentum, it has had a tough 24 hours. This bullish domain attempted to raise prices before retreating when it hit resistance at $0.8047. Bears have taken control of the market as of press time, with prices falling by 0.46% to $0.7972.
This move in the MATIC market was reflected in a 0.15% drop in market capitalization and an 81.64% increase in 24-hour trading volume to $6,979,320,570 and $393,658,479, respectively.
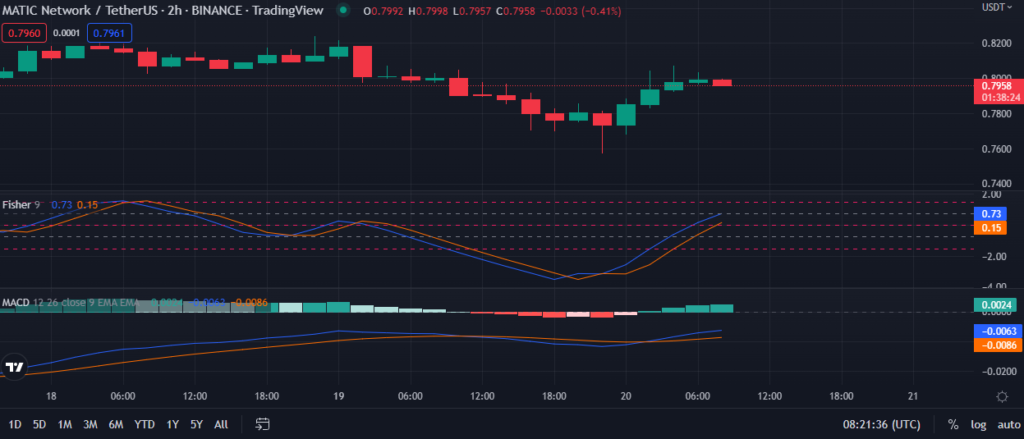
The linear movement of the Bollinger Bands on the MATIC price chart obscures this negative progress, with the upper band hitting $0.8198 and the lower band hitting $0.7711. As purchasing and selling pressures equalize, this movement indicates the end of the bearish trend. When the market price climbs up near the top band, it typically signifies the bulls have the upper hand, as shown on the MATIC 2-hour price chart.
On the 2-hour chart of prices, the Relative Strength Index (RSI) is headed north at 49.99, indicating that the bear’s grasp on the MATIC price is weakening.
In recent hours, the stochastic RSI has been in the overbought zone, with a value of 99.26 indicating that the current trend is coming to an end; however, this does not guarantee that prices will rebound upward but rather acts as a warning to traders.

The market’s negative dominance is expected to cease since the Fisher Transform reads 0.74 and crosses above the signal line, signifying a bullish crossing. Traders are advised to purchase based on the movement of the Fisher Transform, which indicates that the bulls’ strength is increasing.
The advance of the MACD blue line into the negative zone, with a value of -0.0062, however, raises concerns about bear tenacity. However, the fact that it is rising higher and moving out of the negative territory, as well as crossing over the signal line, casts doubt on this bleak outlook.
Bulls must sustain prices above the resistance level in order to reverse the Polygon market’s downward trend.
Disclaimer: The views and opinions, as well as all the information shared in this price analysis, are published in good faith. Readers must do their own research and due diligence. Any action taken by the reader is strictly at their own risk, Coin Edition and its affiliates will not be held liable for any direct or indirect damage or loss.
Disclaimer: The information presented in this article is for informational and educational purposes only. The article does not constitute financial advice or advice of any kind. Coin Edition is not responsible for any losses incurred as a result of the utilization of content, products, or services mentioned. Readers are advised to exercise caution before taking any action related to the company.


