


 Price Prediction 2023-2030: Will LUNA Price Hit $3 Soon?")
- Bullish LUNA price prediction ranges from $0.300 to $3.00.
- Analysis suggests that the LUNA price might reach above $2.5446.
- The LUNA bearish market price prediction for 2023 is $0.3180.
Terra is an open-sourced blockchain project supporting decentralized applications (DApps) development. Its native token is called LUNA.
Terra investors are bullish on the token, although the value of their investment has decreased by over 90% in the past six months. The present all-time high (ATH) price of LUNA is $19.54, attained in May 2022 after a market implosion. Irrespective of the recent crypto winter, LUNA investors are confident that the future of LUNA is bullish.
If you are interested in the future of Terra (LUNA) and want to know the price analysis and price prediction of LUNA for 2023, 2024, 2025, 2026, and up to 2030, keep reading this Coin Edition article?
Table of contents
- Terra (LUNA) Market Overview
- What is Terra (LUNA)?
- Analysts’ View on Terra (LUNA)
- Terra (LUNA) Current Market Status
- Terra (LUNA) Price Prediction 2023-2030 Overview
- Terra (LUNA) Price Prediction 2023
- Terra (LUNA) Price Prediction 2024
- Terra (LUNA) Price Prediction 2025
- Terra (LUNA) Price Prediction 2026
- Terra (LUNA) Price Prediction 2027
- Terra (LUNA) Price Prediction 2028
- Terra (LUNA) Price Prediction 2029
- Terra (LUNA) Price Prediction 2030
- Terra (LUNA) Price Prediction 2040
- Terra (LUNA) Price Prediction 2050
- Conclusion
- FAQ
- More Crypto Price Predictions:
Terra (LUNA) Market Overview
HTTP Request Failed... Error: file_get_contents(https://pro-api.coinmarketcap.com/v2/cryptocurrency/quotes/latest?slug=terra-luna-2): Failed to open stream: HTTP request failed! HTTP/1.1 400 Bad Request
What is Terra (LUNA)?
Terra is an open-source, community-owned blockchain that hosts a vibrant ecosystem of applications. LUNA is the Terra protocol’s native staking token. LUNA is used for governance and mining. Users stake LUNA to validators who record and verify transactions on the blockchain in exchange for rewards from transaction fees.
Terra (LUNA) emerged from Terra Classic, which was home to the algorithmic stablecoin TerraClassicUSD (UST). However, its now-renamed LUNC token collateralized UST, which crashed in a bank run in May 2022. That crash devalued LUNA to virtually zero and caused a launch of a new chain — resulting in Terra Classic and Terra.
The development of Terra Classic launched in January 2018 and the blockchain was launched in April 2019. It was built with the aim of combining the price stability and wide adoption of fiat currencies with the censorship resistance of Bitcoin (BTC) and offering fast and affordable settlements through its UST stablecoin.
Terra Classic offered stablecoins pegged to the U.S. dollar, South Korean won, Mongolian tugrik, and the International Monetary Fund’s Special Drawing Rights basket of currencies.
Analysts’ View on Terra (LUNA)
Cosmosdaily tweeted about the Alliance module unveiling which stole the spotlight on the Terra ecosystem. Moreover, LUNA had a minor increment since after Cosmosdaily tweeted about this.
Terra (LUNA) Current Market Status
LUNA has a circulating supply of 283,255,651 LUNA coins, while its maximum supply is not available, according to CoinMarketCap. At the time of writing, LUNA is trading at $0.8650 representing 24 hours decrease of 0.54%. The trading volume of LUNA in the past 24 hours is $254,119,468 which represents a 462.36% increase.
Some top cryptocurrency exchanges for trading LUNA are Binance, BTCEX, OKX, CoinW, and Deepcoin.
Now that you know LUNA and its current market status, we shall discuss the price analysis of LUNA for 2023.
Terra (LUNA) Price Analysis 2023
Currently, Terra (LUNA) ranks 123 on CoinMarketCap. Will LUNA’s most recent improvements, additions, and modifications help its price go up? First, let’s focus on the charts in this article’s LUNA price forecast.
Terra (LUNA) Price Analysis – Bollinger Bands
The Bollinger bands are a type of price envelope developed by John Bollinger. It gives a range with an upper and lower limit for the price to fluctuate. The Bollinger bands work on the principle of standard deviation and period (time).
The upper band as shown in the chart is calculated by adding two times the standard deviation to the Simple Moving Average while the lower band is calculated by subtracting two times the standard deviation from the Simple Moving Average. When the bands widen, it shows there’s going to be more volatility and when they contract, there is less volatility.
When Bollinger bands are used in a cryptocurrency chart, we could expect the price of the cryptocurrency to reside within the upper and lower bounds of the Bollinger bands 95% of the time. The above thesis is derived from an Empirical law.
The sections highlighted by red rectangles in the chart above show how the bands expand and contract. When the bands widen, we could expect more volatility, and when the bands contract, it denotes less volatility. The green rectangles show how LUNA retraced after touching the upper band (overbought).
When scrutinizing LUNA’s fluctuating pattern, we could see that a large fall (large red candlestick) was followed by small green and red candlesticks
Currently, LUNA has fallen by a large margin. As such, we could expect LUNA to move sideways with small green and red candlesticks. Moreover, since LUNA has currently touched the lower band, we could expect it to retrace toward the SMA.
However, LUNA has a history of continuously touching the lower band before the market corrects the price. Hence, we may see a few more bars of LUNA touch the lower band.
Additionally, the Bollinger band width indicator used at the bottom of the chart seems to be rising, as such, we could expect the bands to widen. Hence, there could be more volatility in the market. However, the bands are titled towards the bottom of the chart, as such, we may see LUNA lose value further.
Terra (LUNA) Price Analysis – Relative Strength Index
The Relative Strength Index is an indicator that is used to find out whether the price of a security is overvalued or undervalued. As per its name, RSI indicators help determine how the security is doing at present, relative to its previous price.
Moreover, it has a signal line which is a Simple Moving Average (SMA) that acts as a yardstick or reference to the RSI line. Hence, whenever the RSI line is above the SMA, it is considered bullish; if it’s below the SMA, it is bearish.
Currently, the RSI is above the Signal, hence, LUNA is bullish. LUNA’s RSI is currently at 34.01 and it is menacingly close to the oversold region. Nonetheless, the line is placed parallel to the horizontal axis. Moreover, LUNA is also moving in the same direction as the RSI, hence, we may see some consolidation.
The Stochastic RSI measures the strength or the weakness of the RSI indicator. As such, it compares the current RSI with the range of past RSI values for a specific period. The StochRSI comes in handy when the market is moving sideways. Since it is sensitive to the smallest RSI movements, it could be used to find out whether the RSI is overbought or oversold when there are sideways movements.
Currently, Stochastic RSI signals a value of 74.30 and it is close to the overbought region. However, the line is placed parallel to the horizontal axis, as such, the Stochastic RSI too signals that there could be consolidation for LUNA.
Additionally, the RSI Support and Resistance (RSI S&R) indicator shows the Crossover Overbought, Crossunder Overbought, Crossover Oversold, and Crossunder Oversold region for a given RSI value.
According to the RSI S&R indicator, we could see that LUNA is almost on the verge of touching the cross-bear zone (blue line). If LUNA crashes further, we may see it seek for support from the cross-bear zone.
We may see it ricochet off of the cross-bear zone and head upwards towards the crossover oversold zone marked (orange cross-line). If the preceding is to happen then the cross-bear zone presents an excellent entry point for buyers. However, if the cross-bear zone doesn’t support LUNA, we may see it reaching for new support regions.
Terra (LUNA) Price Analysis – Moving Average
The Exponential Moving averages are quite similar to the simple moving averages (SMA). However, the SMA equally distributes down all values whereas the Exponential Moving Average gives more weightage to the current prices. Since SMA undermines the weightage of the present price, the EMA is used in price movements.
The 200-day MA is considered to be the long-term moving average while the 50-day MA is considered the short-term moving average in trading. Based on how these two lines behave, the strength of the cryptocurrency or the trend can be determined on average.
In particular, when the short-term moving average (50-day MA) approaches the long-term moving average (200-day MA) from below and crosses it, we call it a Golden Cross.
Contrastingly, when the short-term moving average crosses the long-term moving average from above then, a death cross occurs.
Usually, when a Golden Cross occurs, the prices of the cryptocurrency will shoot up drastically, but when there’s a Death Cross, the prices will crash.
Whenever the price of cryptocurrency is above the 50-day or 200-day MA, or above both we may say that the token is bullish (Red rectangle). Contrastingly, if the token is below the 50-day or 200-day, or below both, then we could call it bearish (Blue triangle section).
Currently, LUNA is trading well below both moving averages and it seems to be going further down. However, when looking at LUNA’s movement in the past we could see that the 50-day MA has acted like the resistance and support level.
We may see LUNA testing the 50-day MA in the near future. But since LUNA has been fluctuating in a pattern that involves a large fall followed by a period of sideways movement, it may take some time for LUNA to test the 50-day MA. However, if it is dominated by the bulls at the beginning of 2023, we may see it rise exponentially.
Terra (LUNA) Price Analysis – Elder Force Index
Elder Force Index is an indicator that was invented by Alexander Elder, who was an entrepreneur. The indicator mainly uses two parameters to adjudicate the buying and selling force and thereby predicts the market trend. In particular, it relies on price change and volume. As such the strength of the buying force or selling force is dependent on either the price change or the volume.
Whenever the EFI is greater than zero, or positive, we could say that the trend is bullish, as there is more buying pressure. However, when the EFI is in the negative zone, we could say that the cryptocurrency is in the negative zone and the selling pressure is more.
Moreover, the Elder Force could also be used to figure out trend reversals and breakouts. For instance when the EFI is making lower highs while the cryptocurrency is making higher highs, then we could say that this is a bearish divergence. However, in the event that the cryptocurrency is making lower lows while the EFI is making higher lows, then it is a bullish divergence represented in the chart.
When considering the chart, we could see that the EFI of LUNA is at -100.366K and the line is positioned parallel to the horizontal axis. Hence, we may see the EFI moving sideways furthermore. However, the Bear Bull Power indicator used in the chart suggests that the bear power is increasing as the line is moving deep into the negative territory. Currently, the BBP records a value of -0.1503, and this may keep on increasing as the days go by.
As such it may take a few more days to satiate the sellers and thereafter the buyer could make it into the market making LUNA surge again. Hence, those looking to enter into a long position may need to consider waiting for the formation of green candlesticks before entering the market.
Terra (LUNA) Price Prediction 2023-2030 Overview
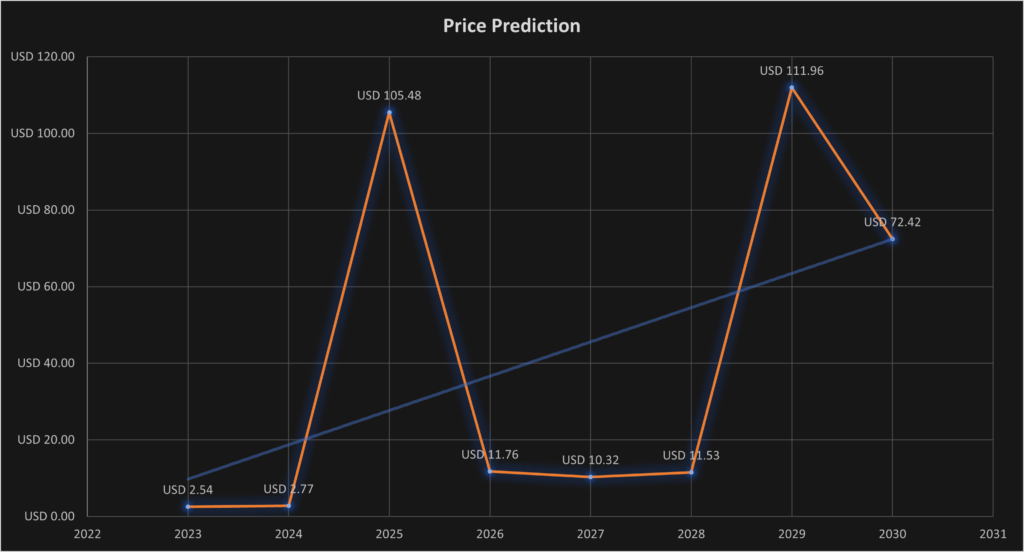
| Year | Minimum Price | Average Price | Maximum Price |
| 2023 | $1.9850 | $2.5446 | $2.6140 |
| 2024 | $2.6925 | $2.7696 | $3.0012 |
| 2025 | $100.102 | $105.48 | $110.25 |
| 2026 | $10.658 | $11.7593 | $12.897 |
| 2027 | $9.782 | $10.3216 | $12.154 |
| 2028 | $10.1125 | $11.5266 | $12.871 |
| 2029 | $105.123 | $111.9567 | $120.587 |
| 2030 | $68.487 | $72.4214 | $78.950 |
| 2040 | $125.64 | $149.5262 | $155.25 |
| 2050 | $203.125 | $217.0436 | $225.002 |
Terra (LUNA) Price Prediction 2023
When considering the chart above we could see that LUNA’s rise early in 2023 was disturbed by its drastic fall. As such LUNA has been trading inside a falling wedge since mid-January. It has been making lower lows and lower highs ever since.
LUNA has almost completed forming the falling wedge, hence, we could expect it to break out from the wedge at any given time. As such, if LUNA breaks out of the wedge close to the given price, we could expect it to rise to almost Resistance 1 at $1.7009. Moreover, as per the practices of trading a falling wedge, when the height of the wedge at the beginning, is set at the breakout point of the wedge, then we could expect LUNA to reach Resistance 1.
However, based on LUNA’s historic behavior, its rise has not stopped with reaching Resistance 1, but it has rather reached Resistance 2 at $ 2.2120. Additionally, we may even see LUNA testing Resistance 3 at $ 2.5446.
As such, traders taking a long position may need to wait for the first glimpse of LUNA breaking out of the wedge and set their entry point at the breakout. Moreover, they may consider having their stop loss close to the lower trend line of the wedge, to give LUNA some slack to fluctuate. Finally, they could set their take profit at their own discretion.
Contrastingly, if LUNA crashes we may see it descend along the 1:1 Gann line. And, at times LUNA breaks the 1:1 Gann line, we may see LUNA testing it. It will interesting to see LUNA make new support levels.
Terra (LUNA) Price Prediction – Resistance and Support Levels
When considering LUNA’s movement since December 2020, we could see that it was fluctuating below the 2:1 Gann line. In particular, LUNA was fluctuating between the 2:1 Gann line and the 8:1 Gann line, except for the part highlighted in a rectangle.
When considering the movement of LUNA after August, we could see that it broke above the 8:1 Gann line and tested the 4:1 Gann line, at times breaking it. However, LUNA wasn’t able to hold above the 4:1 Gann line.
Nonetheless, the latter end of November 2021 brought about a spike for LUNA which helped it rise above the 4:1 Gann line, it rose above the 3:1 Gann line forming the head and shoulder pattern, with the high right shoulder. During this period, the 4:1 Gann line acted as a support for LUNA, although once LUNA crashed below the 4:1 Gann line.
As seen in the chart, the second head and shoulder pattern had a lower left shoulder which tested the 3:1 Gann line. However, following this pattern LUNA crashed in May 2022.
As seen in the chart above LUNA rose along the 1:3 Gann line at times testing and breaking the 1:4 Gann line. Moreover, when considering how it has descended, we could note that it has been fluctuating between the 1:1 and 2:1 Gann lines. Although at times, LUNA tested the 2:1 Gann line taking support from the rising Gann fan, it was obstructed by the 2:1 Gann line.
As such, we could expect LUNA to test the 2:1 Gann fan line in the future. There is a possibility of LUNA breaking the 2:1 Gann line as it is currently trading in a falling wedge. However, if LUNA doesn’t have the momentum to break the above-mentioned Gann line, then it would rebound off it and stay within the highlighted range in the chart.
Terra (LUNA) Price Prediction 2024
There will be Bitcoin halving in 2024, and hence we should expect a positive trend in the market due to user sentiments and the quest by investors to accumulate more of the coin. However, the year of BTC halving didn’t yield the maximum LUNA based on the previous halving. Hence, we could expect LUNA to trade at a price not below $2.7696 by the end of 2024.
Terra (LUNA) Price Prediction 2025
LUNA may experience the after-effects of the Bitcoin halving and is expected to trade much higher than its 2024 price. Many trade analysts speculate that BTC halving could create a huge impact on the crypto market. Moreover, similar to many altcoins, LUNA will continue to rise in 2025 forming new resistance levels. It is expected that LUNA would trade beyond the $104.58 level.
Terra (LUNA) Price Prediction 2026
It is expected that after a long period of bull run, the bears would come into power and start negatively impacting the cryptocurrencies. During this bearish sentiment, LUNA could tumble into its support regions. During this period of price correction, LUNA could lose momentum and be way below its 2025 price. As such it could be trading at $11.7593 by 2026.
Terra (LUNA) Price Prediction 2027
Naturally, traders expect a bullish market sentiment after the crypto industry was affected negatively by the bears’ claw. Moreover, the build-up to the next Bitcoin halving in 2028 could evoke excitement in traders. However, that excitement has not been reciprocated in LUNA. As such, we could expect LUNA to trade just below its 2026 value at around $10.3216 by the end of 2027.
Terra (LUNA) Price Prediction 2028
As the crypto community’s hope will be re-ignited looking forward to Bitcoin halving like many altcoins, LUNA may reciprocate its past behavior during the BTC halving. Hence, LUNA would be trading at $11.5266 after experiencing a considerable surge by the end of 2028.
Terra (LUNA) Price Prediction 2029
2029 is expected to be another bull run due to the aftermath of the BTC halving. However, traders speculate that the crypto market would gradually become stable by this year. In tandem with the stable market sentiment, LUNA could be trading at $111.9567 by the end of 2029.
Terra (LUNA) Price Prediction 2030
After witnessing a bullish run in the market, LUNA and many altcoins would show signs of consolidation and might trade sideways and move downwards for some time while experiencing minor spikes. Therefore, by the end of 2030, LUNA could be trading at $72.4214
Terra (LUNA) Price Prediction 2040
The long-term forecast for LUNA indicates that this altcoin could reach a new all-time high(ATH). This would be one of the key moments as HODLERS may expect to sell some of their tokens at the ATH point.
If they start selling then LUNA could fall in value. It is expected that the average price of LUNA could reach $149.5262 by 2040.
Terra (LUNA) Price Prediction 2050
The community believes that there will be widespread adoption of cryptocurrencies, which could maintain gradual bullish gains. By the end of 2050, if the bullish momentum is maintained, LUNA could hit $217.0436
Conclusion
If investors continue showing their interest in LUNA and add these tokens to their portfolio, it could continue to rise. LUNA’s bullish price prediction shows that it could reach the $2.5446 level.
FAQ
Terra is an open-source, community-owned blockchain that hosts a vibrant ecosystem of applications. LUNA is the Terra protocol’s native staking token. LUNA is used for governance and mining.
LUNA tokens can be traded on many exchanges like Binance, OKX, BTCEX, Deepcoin, and Bitrue.
LUNA has a possibility of surpassing its present all-time high (ATH) price of $19.54 in 2022.
LUNA is one of the few cryptocurrencies that has shown resilience. If LUNA breaks out of its falling wedge, it might reach $2.5 soon after it breaks the Resistance 1 and 2levels.
LUNA has been one of the most suitable investments in the crypto space. It is highly volatile, as such, it has quite a margin when its price fluctuates. Hence, traders may be allured to invest in LUNA. It’s a good investment in the short term and in the long term as well.
The present all-time low price of LUNA is $0.7209.
The maximum supply of LUNA is unavailable.
LUNA can be stored in a cold wallet, hot wallet, or exchange wallet.
Terra was founded by Daniel Shin and Do Kwon.
It was launched in 2018.
LUNA is expected to reach $2.5446 by 2023.
LUNA is expected to reach $2.7696 by 2024.
LUNA is expected to reach $105.48 by 2025.
LUNA is expected to reach $11.7593 by 2026.
LUNA is expected to reach $10.3216 by 2027.
LUNA is expected to reach $11.5266 by 2028.
LUNA is expected to reach $111.9567 by 2029.
LUNA is expected to reach $72.4214 by 2030.
LUNA is expected to reach $149.5262 by 2040.
LUNA is expected to reach $217.0436 by 2050.
Disclaimer: The views and opinions, as well as all the information shared in this price prediction, are published in good faith. Readers must do their own research and due diligence. Any action taken by the reader is strictly at their own risk. Coin Edition and its affiliates will not be held liable for any direct or indirect damage or loss.
More Crypto Price Predictions:
- Celo (CELO) Price Prediction 2023-2030
- Nem (XEM) Price Prediction 2023-2030
- Nexo (NEXO) Price Prediction 2023-2030
- Pancake Swap (CAKE) Price Prediction 2023-2030
Disclaimer: The information presented in this article is for informational and educational purposes only. The article does not constitute financial advice or advice of any kind. Coin Edition is not responsible for any losses incurred as a result of the utilization of content, products, or services mentioned. Readers are advised to exercise caution before taking any action related to the company.
: What Happens If You Use an Unlicensed Platform?")


