


 Records 7-Day High, Golden Cross Denotes Bullish Breakout")
- Tezos (XTZ) sees bullish control and potential resistance at $1.30 and $1.40.
- Golden cross signal and rising above moving averages signal likely uptrend.
- Bearish crossing in Klinger Oscillator signals possible correction, but KST suggests buying opportunities.
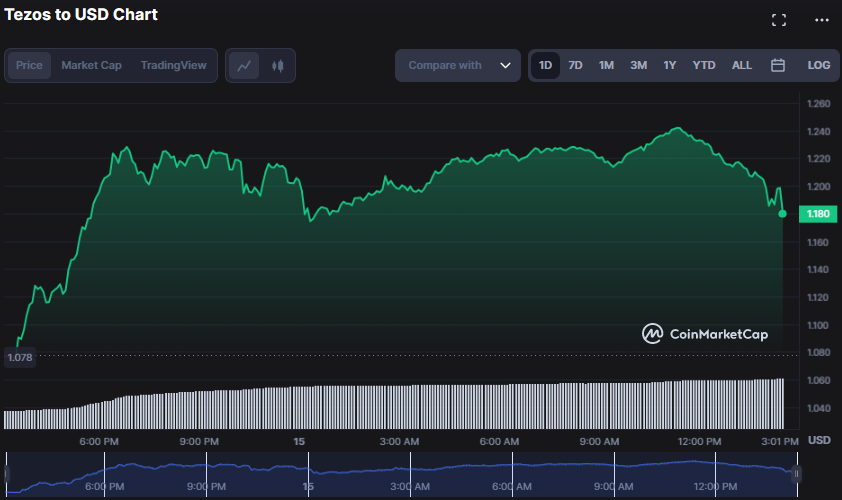
Tezos (XTZ) has risen from an intraday low of $1.07 in the previous 24 hours owing to positive market domination. As a result of the solid bullish control, the XTZ price gradually rose to $1.24, its 7-day high, demonstrating the bullish control. At the time of writing, the price of XTZ had risen to $1.19, an increase of 10.51 %.
If the bullish momentum continues and the $1.24 resistance level fails to hold, the next resistance levels might be around $1.30 and $1.40, respectively. But, if bearish pressure prevails, support levels at $1.10 and $1.00 may be tested.
Traders boarding the bull train increased market capitalization and 24-hour trading volume by 10.28% and 193.41%, respectively, to $89,910,019 and $89,910,019. This increase was driven mainly by increased demand for the asset as more investors tried to capitalize on the optimistic market trend and prospective rewards.
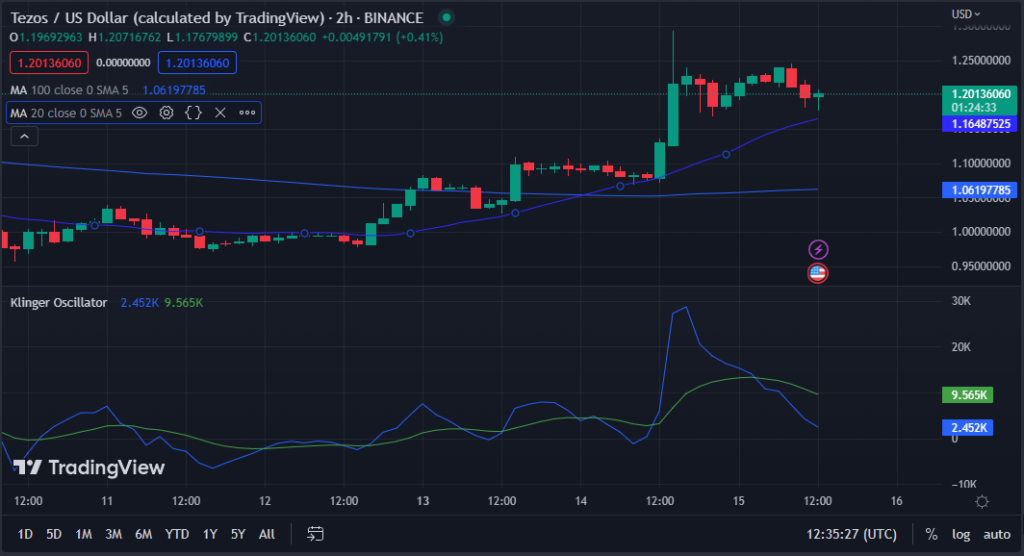
The short-term MA recently crossed the long-term MA on the XTZ 2-hour price chart, providing a “golden cross” signal and signaling a likely bullish trend soon. The 20-day MA is 1.16397891, while the 100-day MA is 1.06179858, indicating this move.
In addition, price action that rises above both moving averages bolsters hopes for an uptrend soon by signaling that the short-term trend is bullish and the long-term trend is becoming favorable.
Nevertheless, the Klinger Oscillator has formed a bearish crossing, falling below its signal line with a value of 2.552K. The bullish momentum may be losing steam, and investors should keep a watch on additional price action to check if the uptrend will continue or whether a correction is approaching.
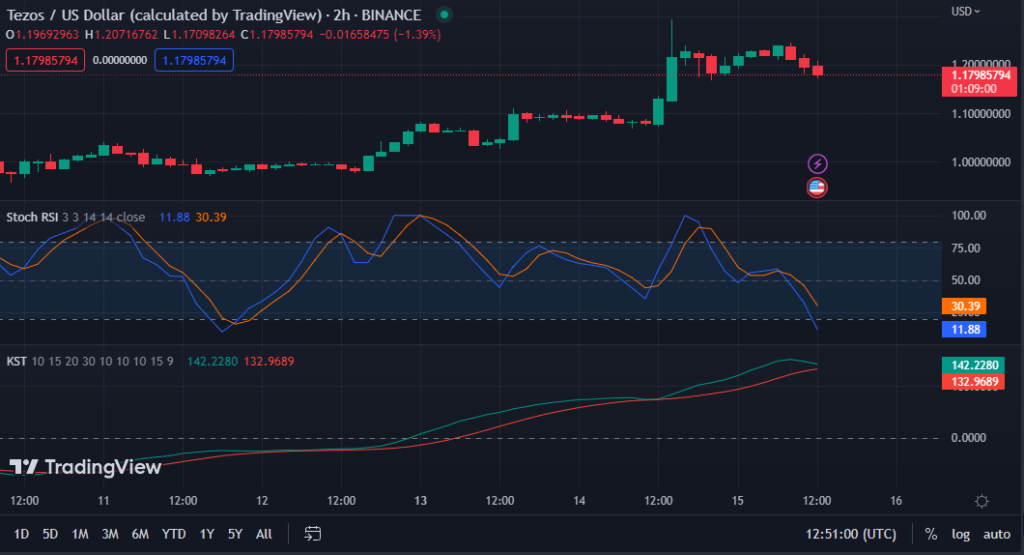
While the stochastic RSI on the XTZ price chart is in the oversold area with a value of 14.31, the market’s bullishness may rise soon as traders view this as a possible buying opportunity. The formation of a golden cross supports this movement as it signals a probable bullish breakout in the short future.
The Know Sure Thing (KST) reading of 143.1022 and the rise above its signal line support the probable bullish breakout and indicate that momentum is high, enhancing the chance of more price gains in the near term.
This KST movement suggests that there may be buying chances for traders trying to capitalize on the rising trend and benefit from market movement.
XTZ’s bullish momentum gains steam as traders hop on the bull train, surpassing resistance levels, and forming a golden cross, indicating a likely uptrend.
Disclaimer: The views, opinions, and information shared in this price prediction are published in good faith. Readers must do their research and due diligence. Any action taken by the reader is strictly at their own risk. Coin Edition and its affiliates will not be liable for direct or indirect damage or loss.
Disclaimer: The information presented in this article is for informational and educational purposes only. The article does not constitute financial advice or advice of any kind. Coin Edition is not responsible for any losses incurred as a result of the utilization of content, products, or services mentioned. Readers are advised to exercise caution before taking any action related to the company.


