


 Shows Signs of Recovery Amid Bearish Trend")
- THORChain (RUNE) faces bearish pressure as prices dip to $5.44.
- Keltner Channel bands signal bearish pressure, but bullish candlestick patterns hint at a potential market mood shift for RUNE.
- RSI’s rise above 50 suggests growing buying strength in RUNE’s market.
In the previous 24 hours, the THORChain (RUNE) market has been dominated by bears, with prices witnessing a significant downward trend. As selling pressure remains stronger than buying demand, bullish efforts to recoup have been met with substantial resistance.
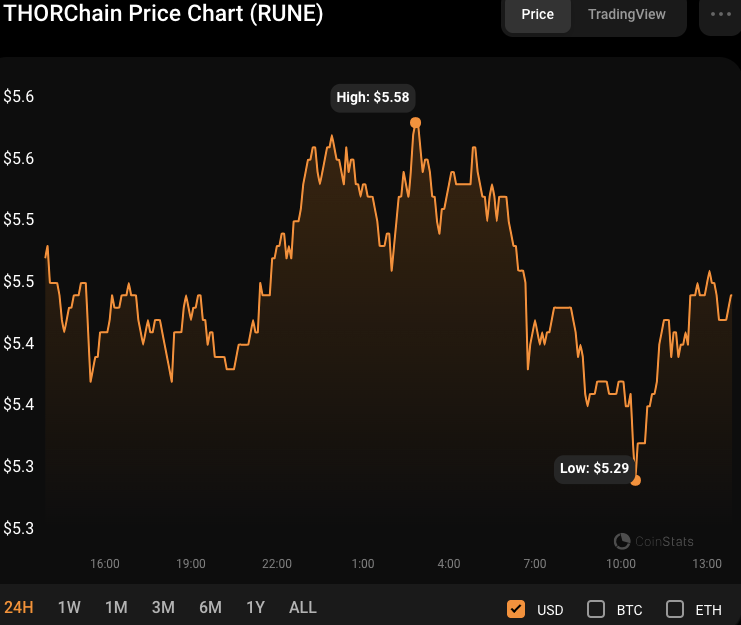
RUNE’s downward trend remained in control, with prices trading hands at $5.44 at press time, a 0.80% drop from the intraday high of $5.58, according to CoinStats. If the bearish trend breaks through the intraday low of $5.40, it might lead to additional selling pressure, with the next support level at $5.20.
However, if bulls retake the intraday high and push prices above $5.58, it might signal a possible reversal in the negative trend, with the next level of resistance anticipated at about $5.80. On the other hand, RUNE’s market capitalization and 24-hour trading volume fell by 0.69% and 51.13%, to $1,838,625,736 and $200,061,694, respectively.
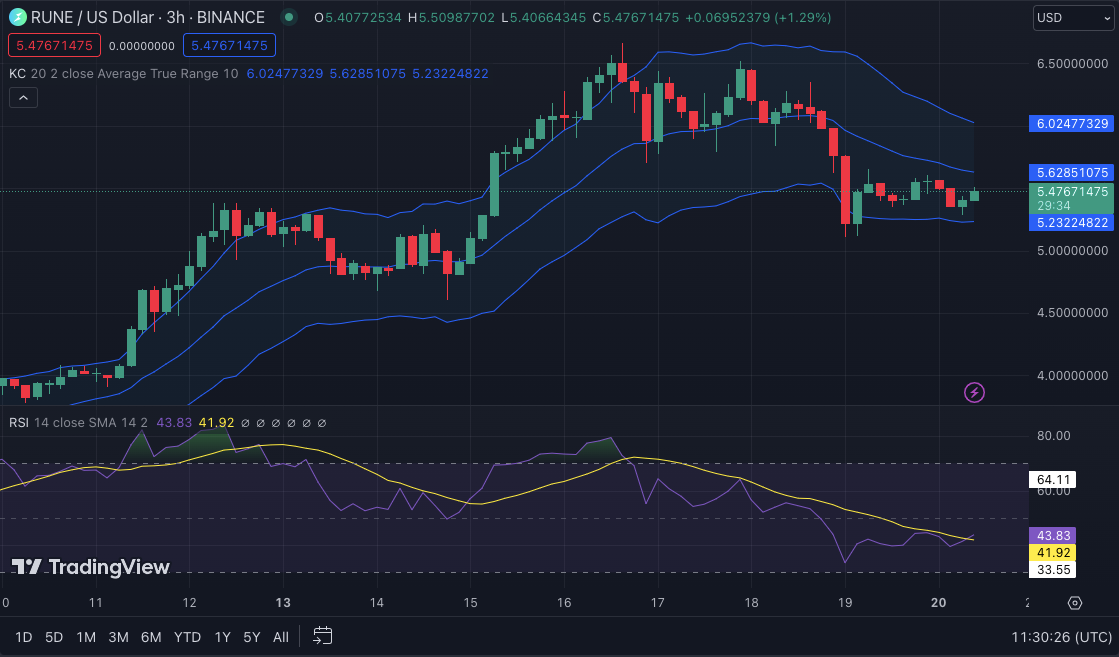
On the RUNEUSD 3-hour price chart, the Keltner Channel bands are trending downward, with the upper, middle, and lower bands touching $6.04515935, $5.62821886, and $5.23310402, respectively, indicating significant bearish pressure on the RUNE market. Furthermore, the declining trading volume suggests a lack of purchasing interest in the market, which supports the downward trend.
On the other hand, the bullish candlestick patterns appearing on the chart signal that the price action has rebounded off the lower band and is now showing indications of a probable reversal. This pattern might indicate a change in market mood and an opportunity for buyers to join the market.
Furthermore, with a reading of 43.93, the Relative Strength Index (RSI) has climbed above the signal line, suggesting a possible rise in purchasing pressure. This change in the RSI indicates that buyers are building up strength and may drive the price much higher. If the RSI continues to increase and above 50, it might show more significant bullish momentum and draw additional buyers.
In conclusion, while THORChain (RUNE) faces bearish pressure, signs of a potential reversal emerge, with RSI indicating rising buyer strength.
Disclaimer: The information presented in this article is for informational and educational purposes only. The article does not constitute financial advice or advice of any kind. Coin Edition is not responsible for any losses incurred as a result of the utilization of content, products, or services mentioned. Readers are advised to exercise caution before taking any action related to the company.


